

NVIDIA reached a record $51.2 billion in datacenter revenue in Q3 fiscal 2026—up 25% from the prior quarter and 66% year-over-year—with total revenue hitting $57 billion. According to NVIDIA's Q3 fiscal 2026 earnings and The Verge's coverage, datacenter revenue grew by $10 billion in a single quarter; Tom's Hardware reports all GPUs sold out and CEO Jensen Huang stating that Blackwell sales are off the charts. Statista's data center AI GPU market share and industry analysis place NVIDIA at over 80% of the data center AI GPU market, with Blackwell driving the majority of new deployments. Python is the tool many teams use to visualize datacenter and GPU adoption data for reports like this one. This article examines why NVIDIA crossed $51B in datacenter revenue, how AI infrastructure demand shapes the market, and how Python powers the charts that tell the story.
$51.2B Datacenter: Record Quarter and $10B Sequential Jump
NVIDIA's datacenter growth did not happen overnight. NVIDIA's Q3 FY2026 release reports $51.2 billion in datacenter revenue for the quarter ended October 26, 2025—up 25% from Q2 and 66% year-over-year; NVIDIA's Q2 FY2026 results show $41.1 billion in Q2 (up 5% sequentially and 56% YoY). The Verge notes the $10 billion quarter-over-quarter increase in datacenter alone. The following chart, generated with Python and matplotlib using industry-style data, illustrates NVIDIA datacenter revenue (billions USD) by quarter from fiscal 2024 through 2026.
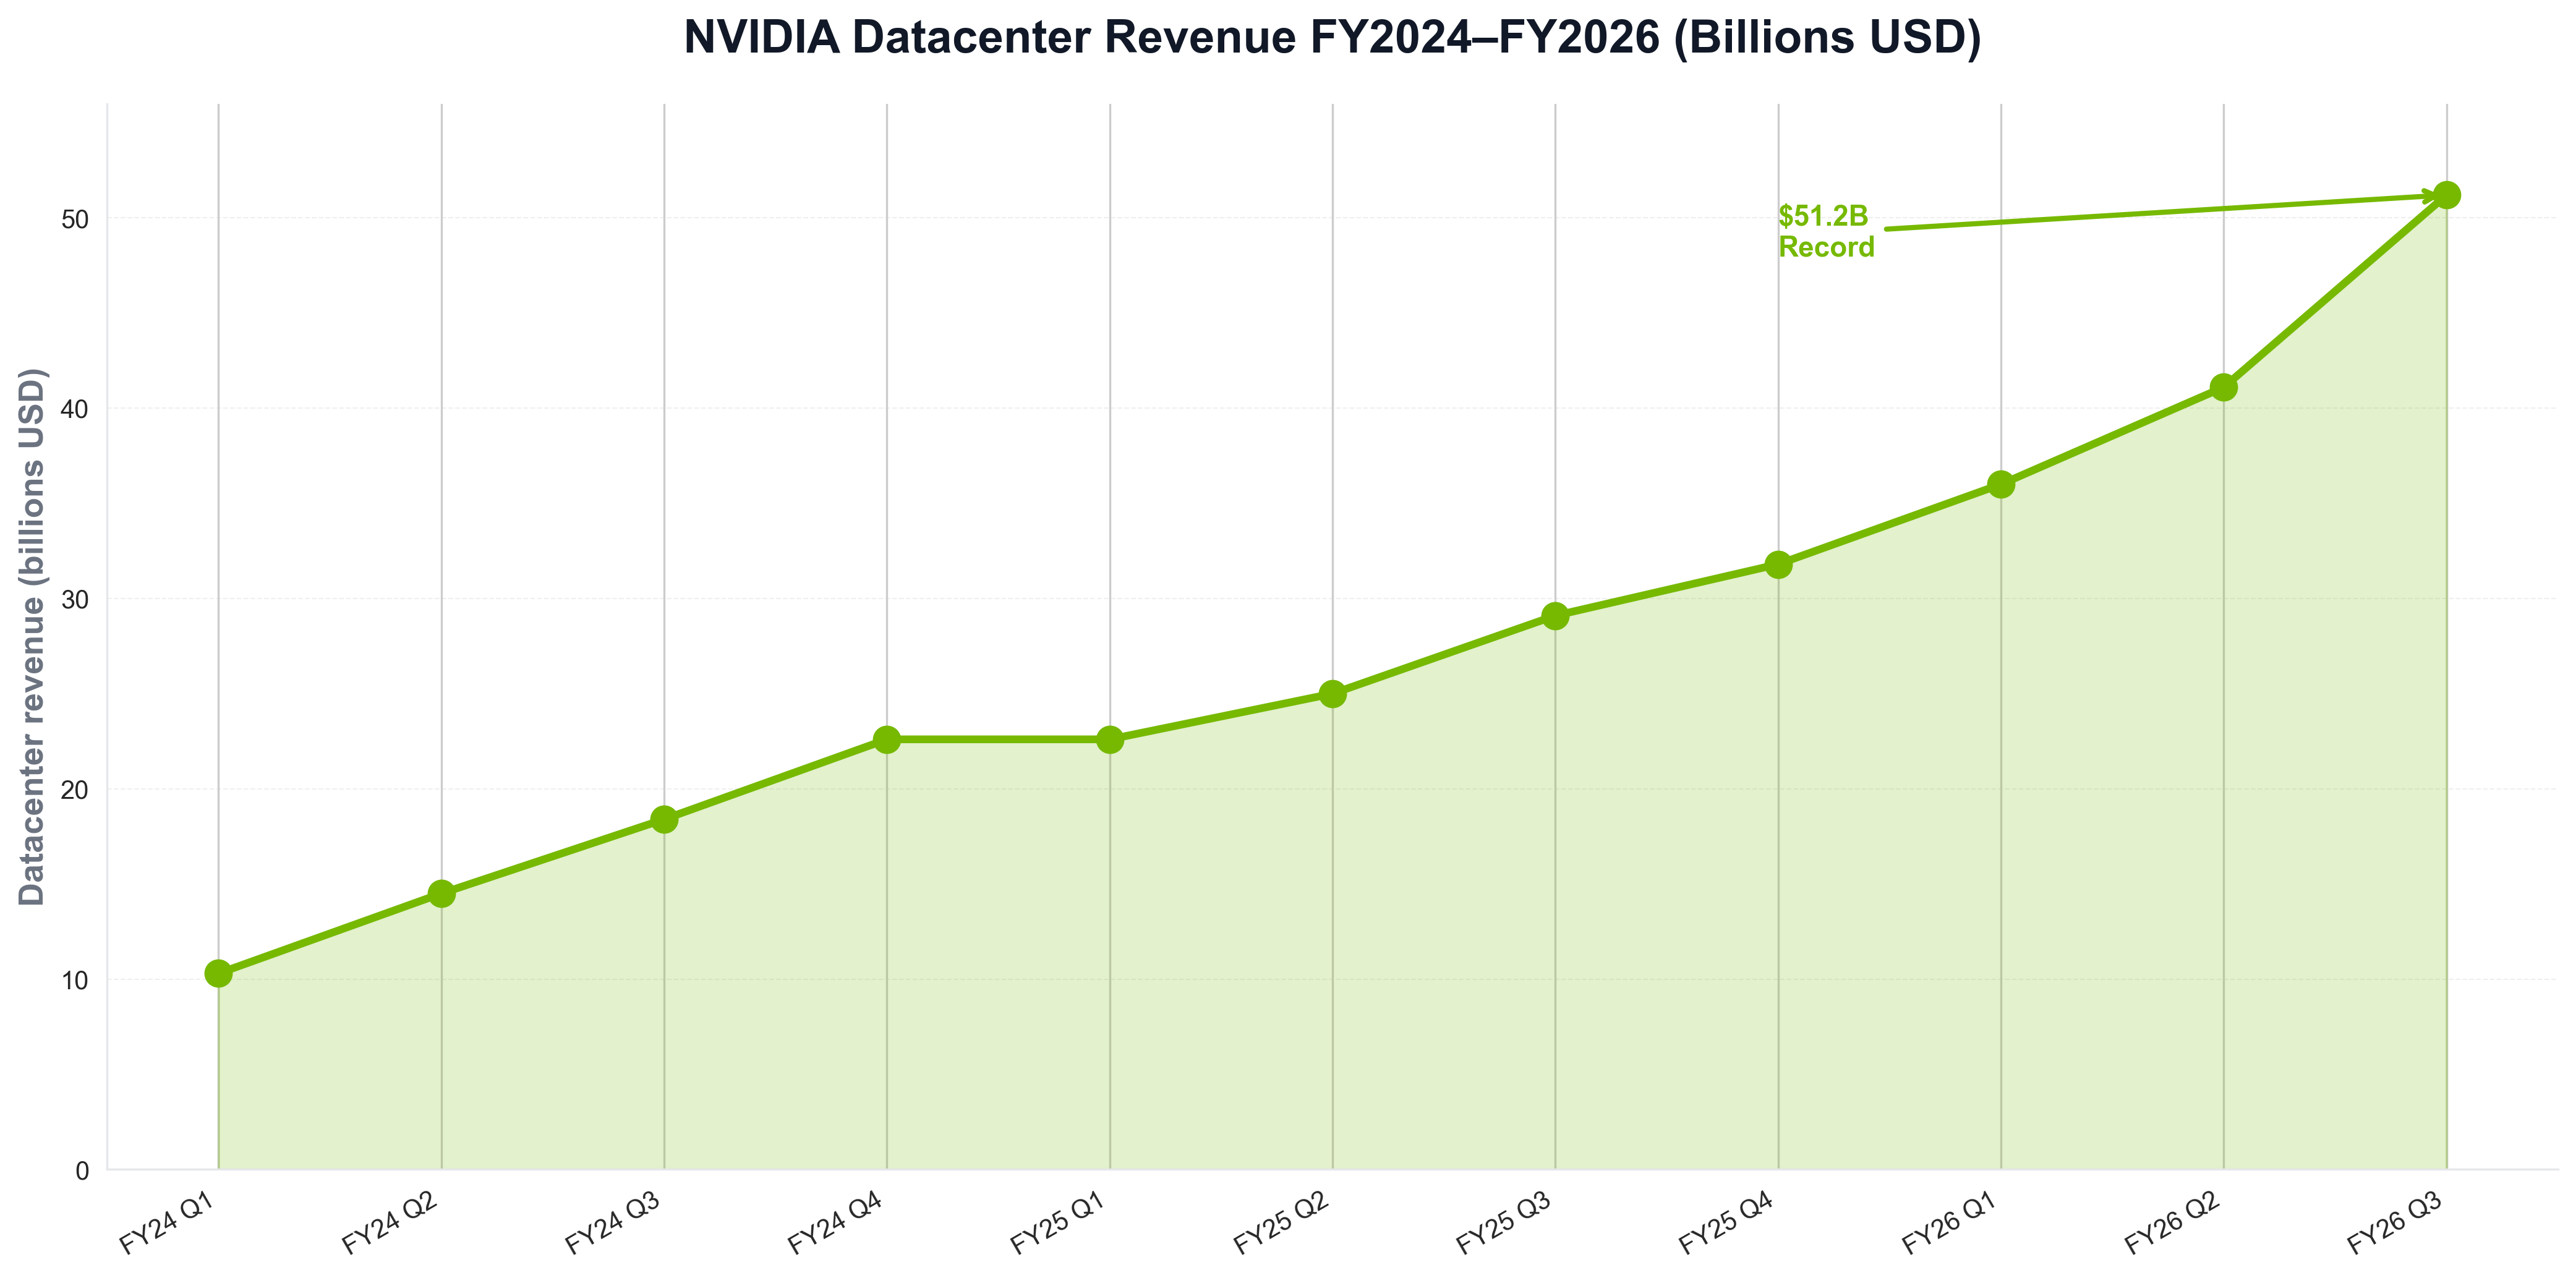
The chart above shows $51.2B in Q3 FY2026—reflecting Blackwell ramp and hyperscaler demand. Python is the natural choice for building such visualizations: semiconductor and cloud teams routinely use Python scripts to load earnings or market data and produce publication-ready charts for reports and articles like this one.
80%+ AI GPU Share: Blackwell and Market Dominance
The scale of NVIDIA's AI GPU lead is striking. Statista reports NVIDIA increasing its data center AI GPU market share in 2025 with the rollout of Blackwell, which offers significant performance and efficiency gains over Hopper; industry estimates place NVIDIA at over 80% of the segment, with discrete data center GPU share reaching around 94% in some quarters versus AMD. Nasdaq's analysis and NVIDIA's earnings describe Blackwell as the leading architecture across all customer categories. When teams need to visualize market share or revenue by segment, they often use Python and matplotlib or seaborn. The following chart, produced with Python, summarizes data center AI GPU market share (NVIDIA vs AMD vs others) in a style consistent with industry reports.
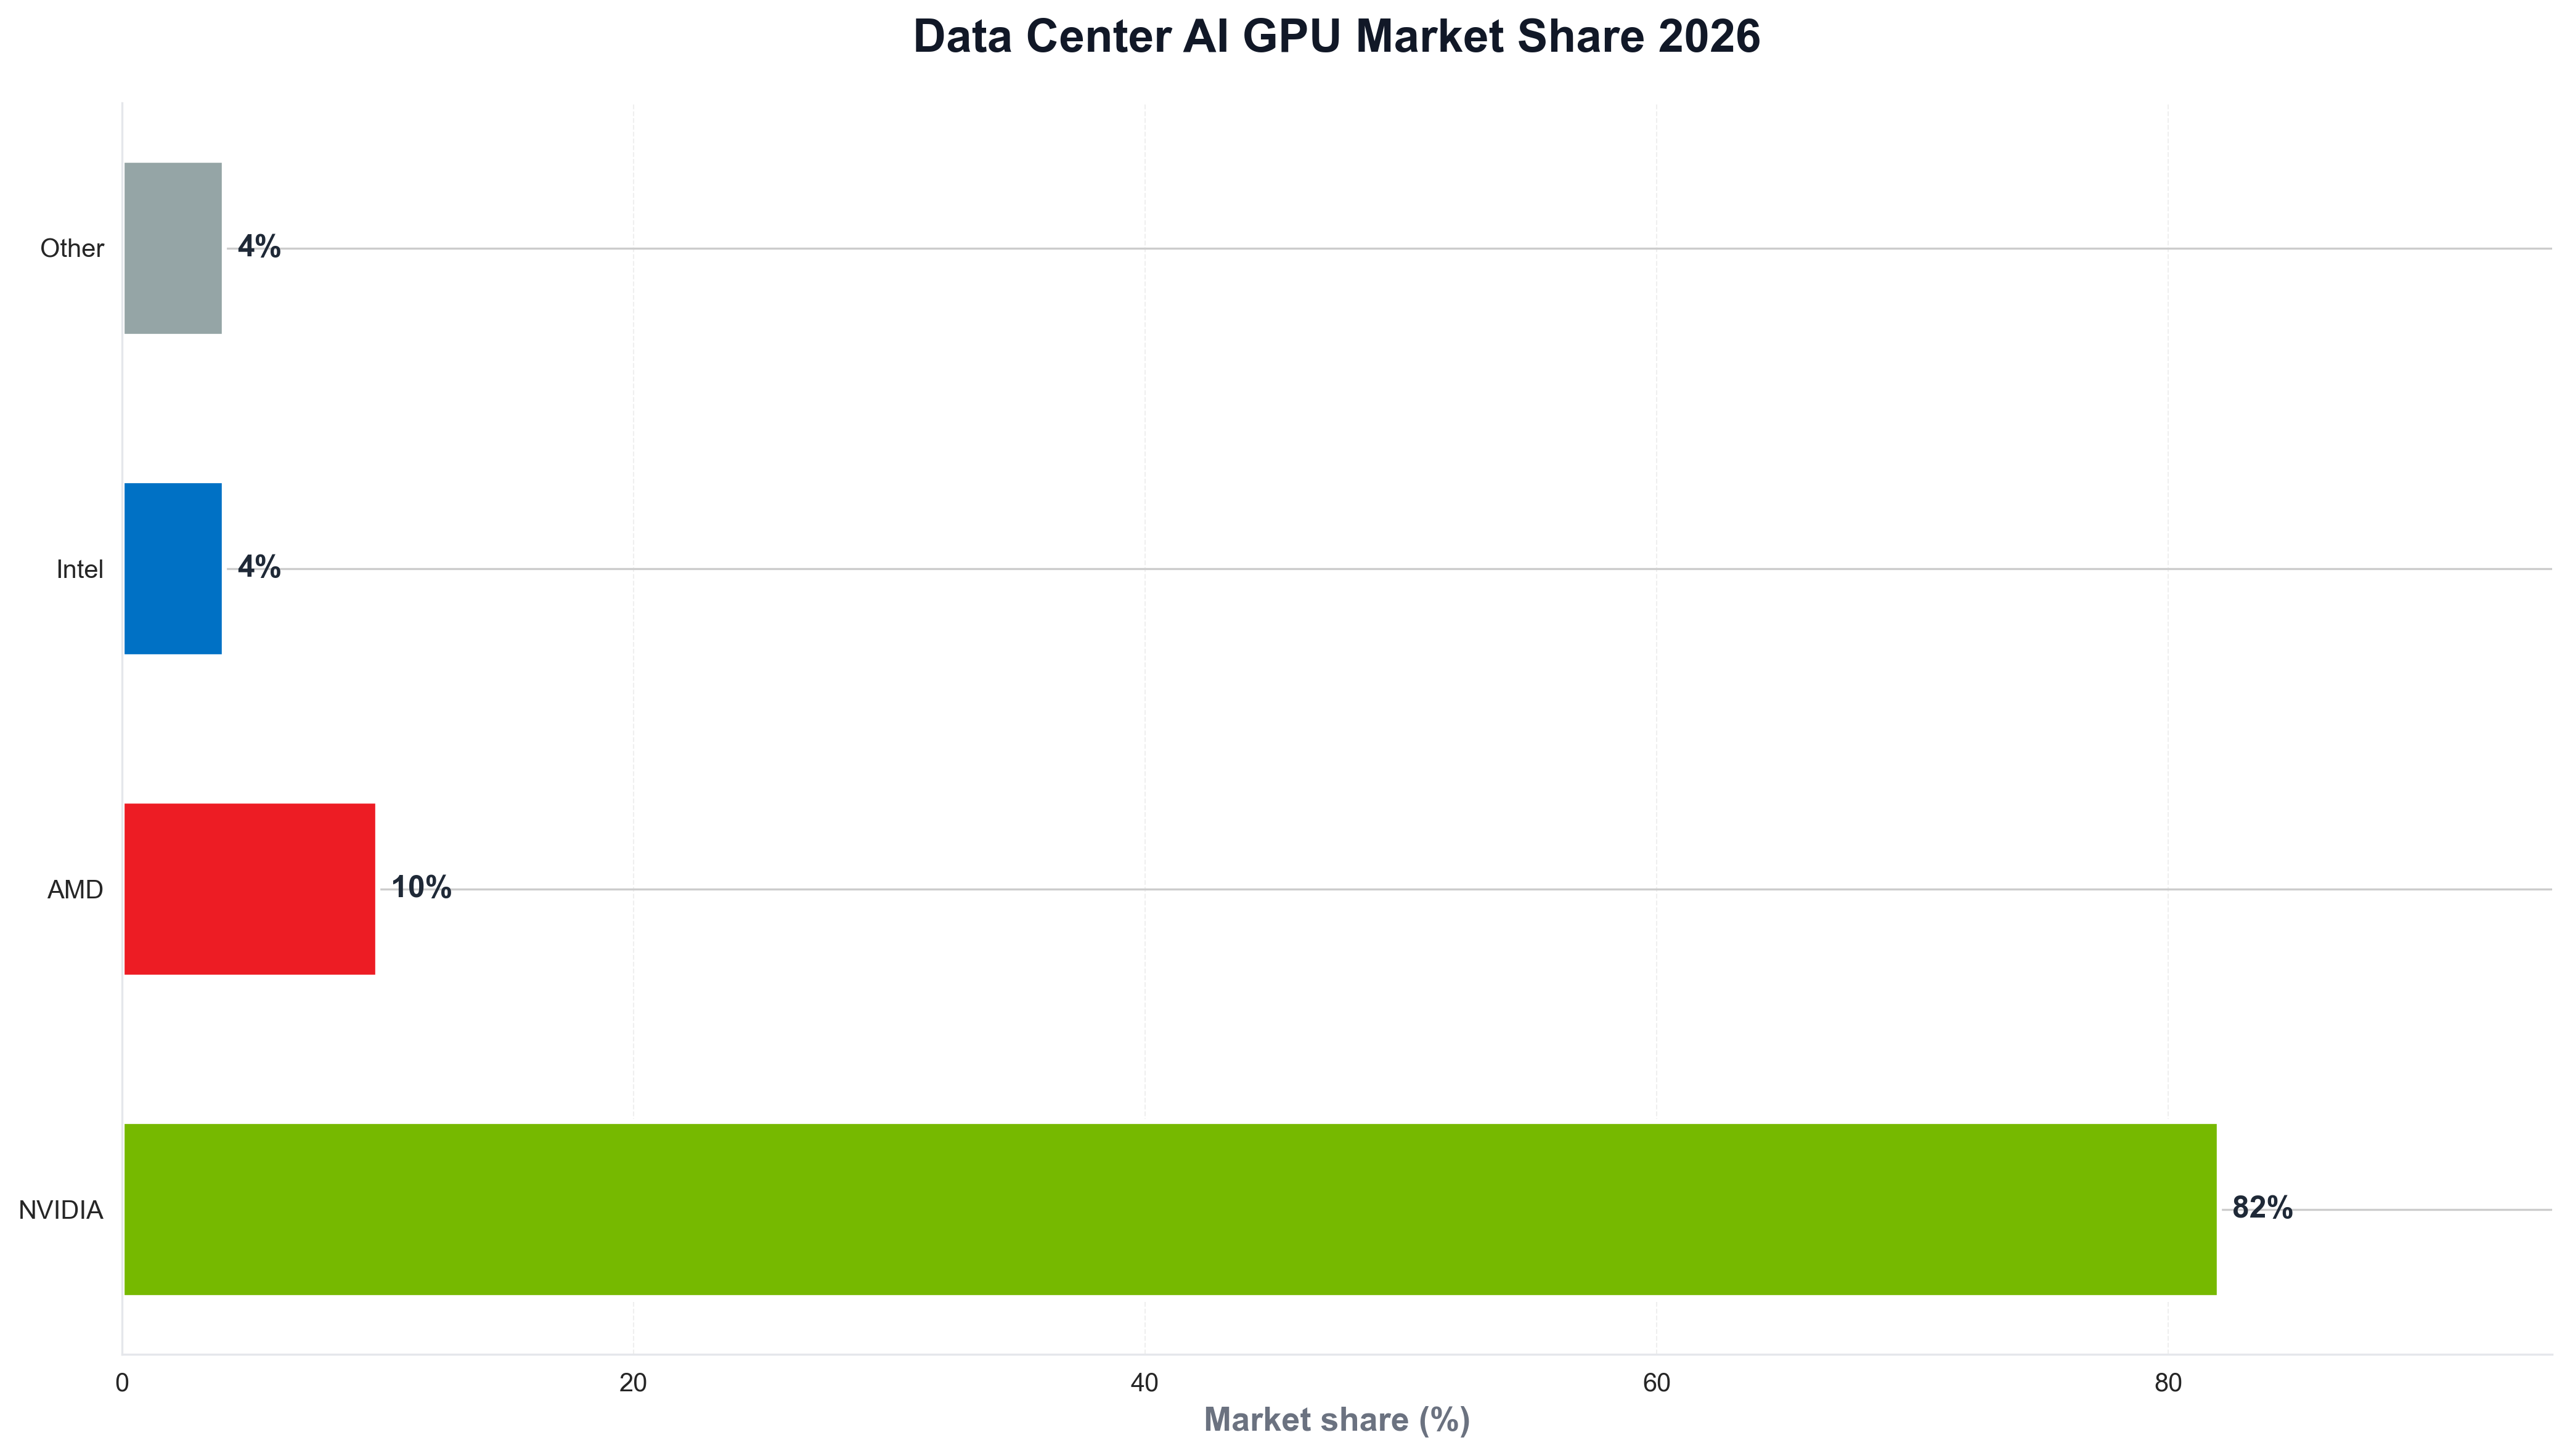
The chart illustrates NVIDIA well ahead of AMD and others—context that explains why hyperscalers and enterprises choose NVIDIA for training and inference. Python is again the tool of choice for generating such charts from market or earnings data, keeping analytics consistent with the rest of the data stack.
Blackwell Sold Out, Cloud GPUs Backordered: Why Demand Outstrips Supply
Demand intensity is central to NVIDIA's 2026 story. Tom's Hardware and NVIDIA's Q3 release report that Blackwell sales are off the charts and cloud GPUs are sold out; The Verge notes $10 billion datacenter growth in just three months. NVIDIA's CFO commentary and earnings materials describe Blackwell as the dominant architecture for AI training and inference. For teams that track datacenter revenue or GPU shipments over time, Python is often used to load financial or telemetry data and plot trends. A minimal example might look like the following: load a CSV of NVIDIA datacenter revenue by quarter, and save a chart for internal or public reporting.
import pandas as pd
import matplotlib.pyplot as plt

df = pd.read_csv("nvidia_datacenter_revenue_by_quarter.csv")
fig, ax = plt.subplots(figsize=(10, 5))
ax.plot(df["quarter"], df["revenue_billions"], marker="o", linewidth=2, color="#76b900")
ax.set_ylabel("Datacenter revenue (billions USD)")
ax.set_title("NVIDIA datacenter revenue (industry style)")
fig.savefig("public/images/blog/nvidia-datacenter-trend.png", dpi=150, bbox_inches="tight")
plt.close()
That kind of Python script is typical for semiconductor and cloud analysts: same language used for pipelines and dashboards, and direct control over chart layout and messaging.
$57B Total Revenue, 90% Datacenter: The AI Infrastructure Era
Revenue mix and outlook shape NVIDIA's 2026 story. NVIDIA Q3 FY2026 reports $57.0 billion total revenue (record), with datacenter representing approximately 90% of revenue; Q4 FY2026 guidance is $65.0 billion (plus or minus 2%). Statista's data center segment revenue and NVIDIA investor materials show NVIDIA's datacenter segment substantially outpacing AMD and Intel. Python is the language many use to analyze semiconductor and cloud data and visualize revenue and market share for reports like this one.
Conclusion: NVIDIA as the AI Infrastructure Default in 2026
In 2026, NVIDIA is the default for AI datacenter compute: $51.2 billion datacenter revenue in Q3 FY2026, $57 billion total revenue, over 80% of the data center AI GPU market, and Blackwell sold out. Cloud GPUs are backordered and hyperscalers are deploying at scale. Python remains the language that powers the analytics—revenue, market share, and the visualizations that explain the story—so that for Google News and Google Discover, the story in 2026 is clear: NVIDIA is where AI runs, and Python is how many of us chart it.


