

AWS Lambda has become the default serverless platform in 2026. According to TechTarget's analysis of serverless platform adoption, AWS Lambda commands 70% of the active serverless platform user base—significantly ahead of Google Cloud Functions (13%) and Microsoft Azure Functions (12%). AWS's Lambda tenth-anniversary blog and Serverless ICYMI Q4 2024 report that Lambda now serves over 1.5 million monthly customers and processes tens of trillions of requests each month. Datadog's State of Serverless adds that over 70% of AWS customers use one or more serverless solutions, with 60% of Google Cloud and 49% of Azure customers using serverless. AWS was named a Leader in the 2025 Forrester Wave: Serverless Development Platforms, achieving the highest ranking in both Current Offering and Strategy. The story in 2026 is that Lambda is the default for serverless and event-driven workloads—and Python is the language many teams use to write Lambda functions and visualize adoption and cost. This article examines why 70% of serverless runs on Lambda, how Python fits the stack, and how Python powers the charts that tell the story.
70% of Serverless Platform Users Run on AWS Lambda
Lambda's lead in serverless did not happen overnight. TechTarget's AWS Lambda serverless platform analysis and InformationWeek's report on Lambda dominance report that AWS Lambda holds 70% of the active serverless platform user base—Google Cloud Functions at 13% and Microsoft Azure Functions at 12%. Lambda was released in 2014, two years ahead of competing platforms, giving it first-mover advantage; broad integration with AWS services, ease of use, and strong developer adoption make it the default for many teams. The following chart, generated with Python and matplotlib using Datadog and industry-style data, illustrates serverless platform share in 2025–2026.
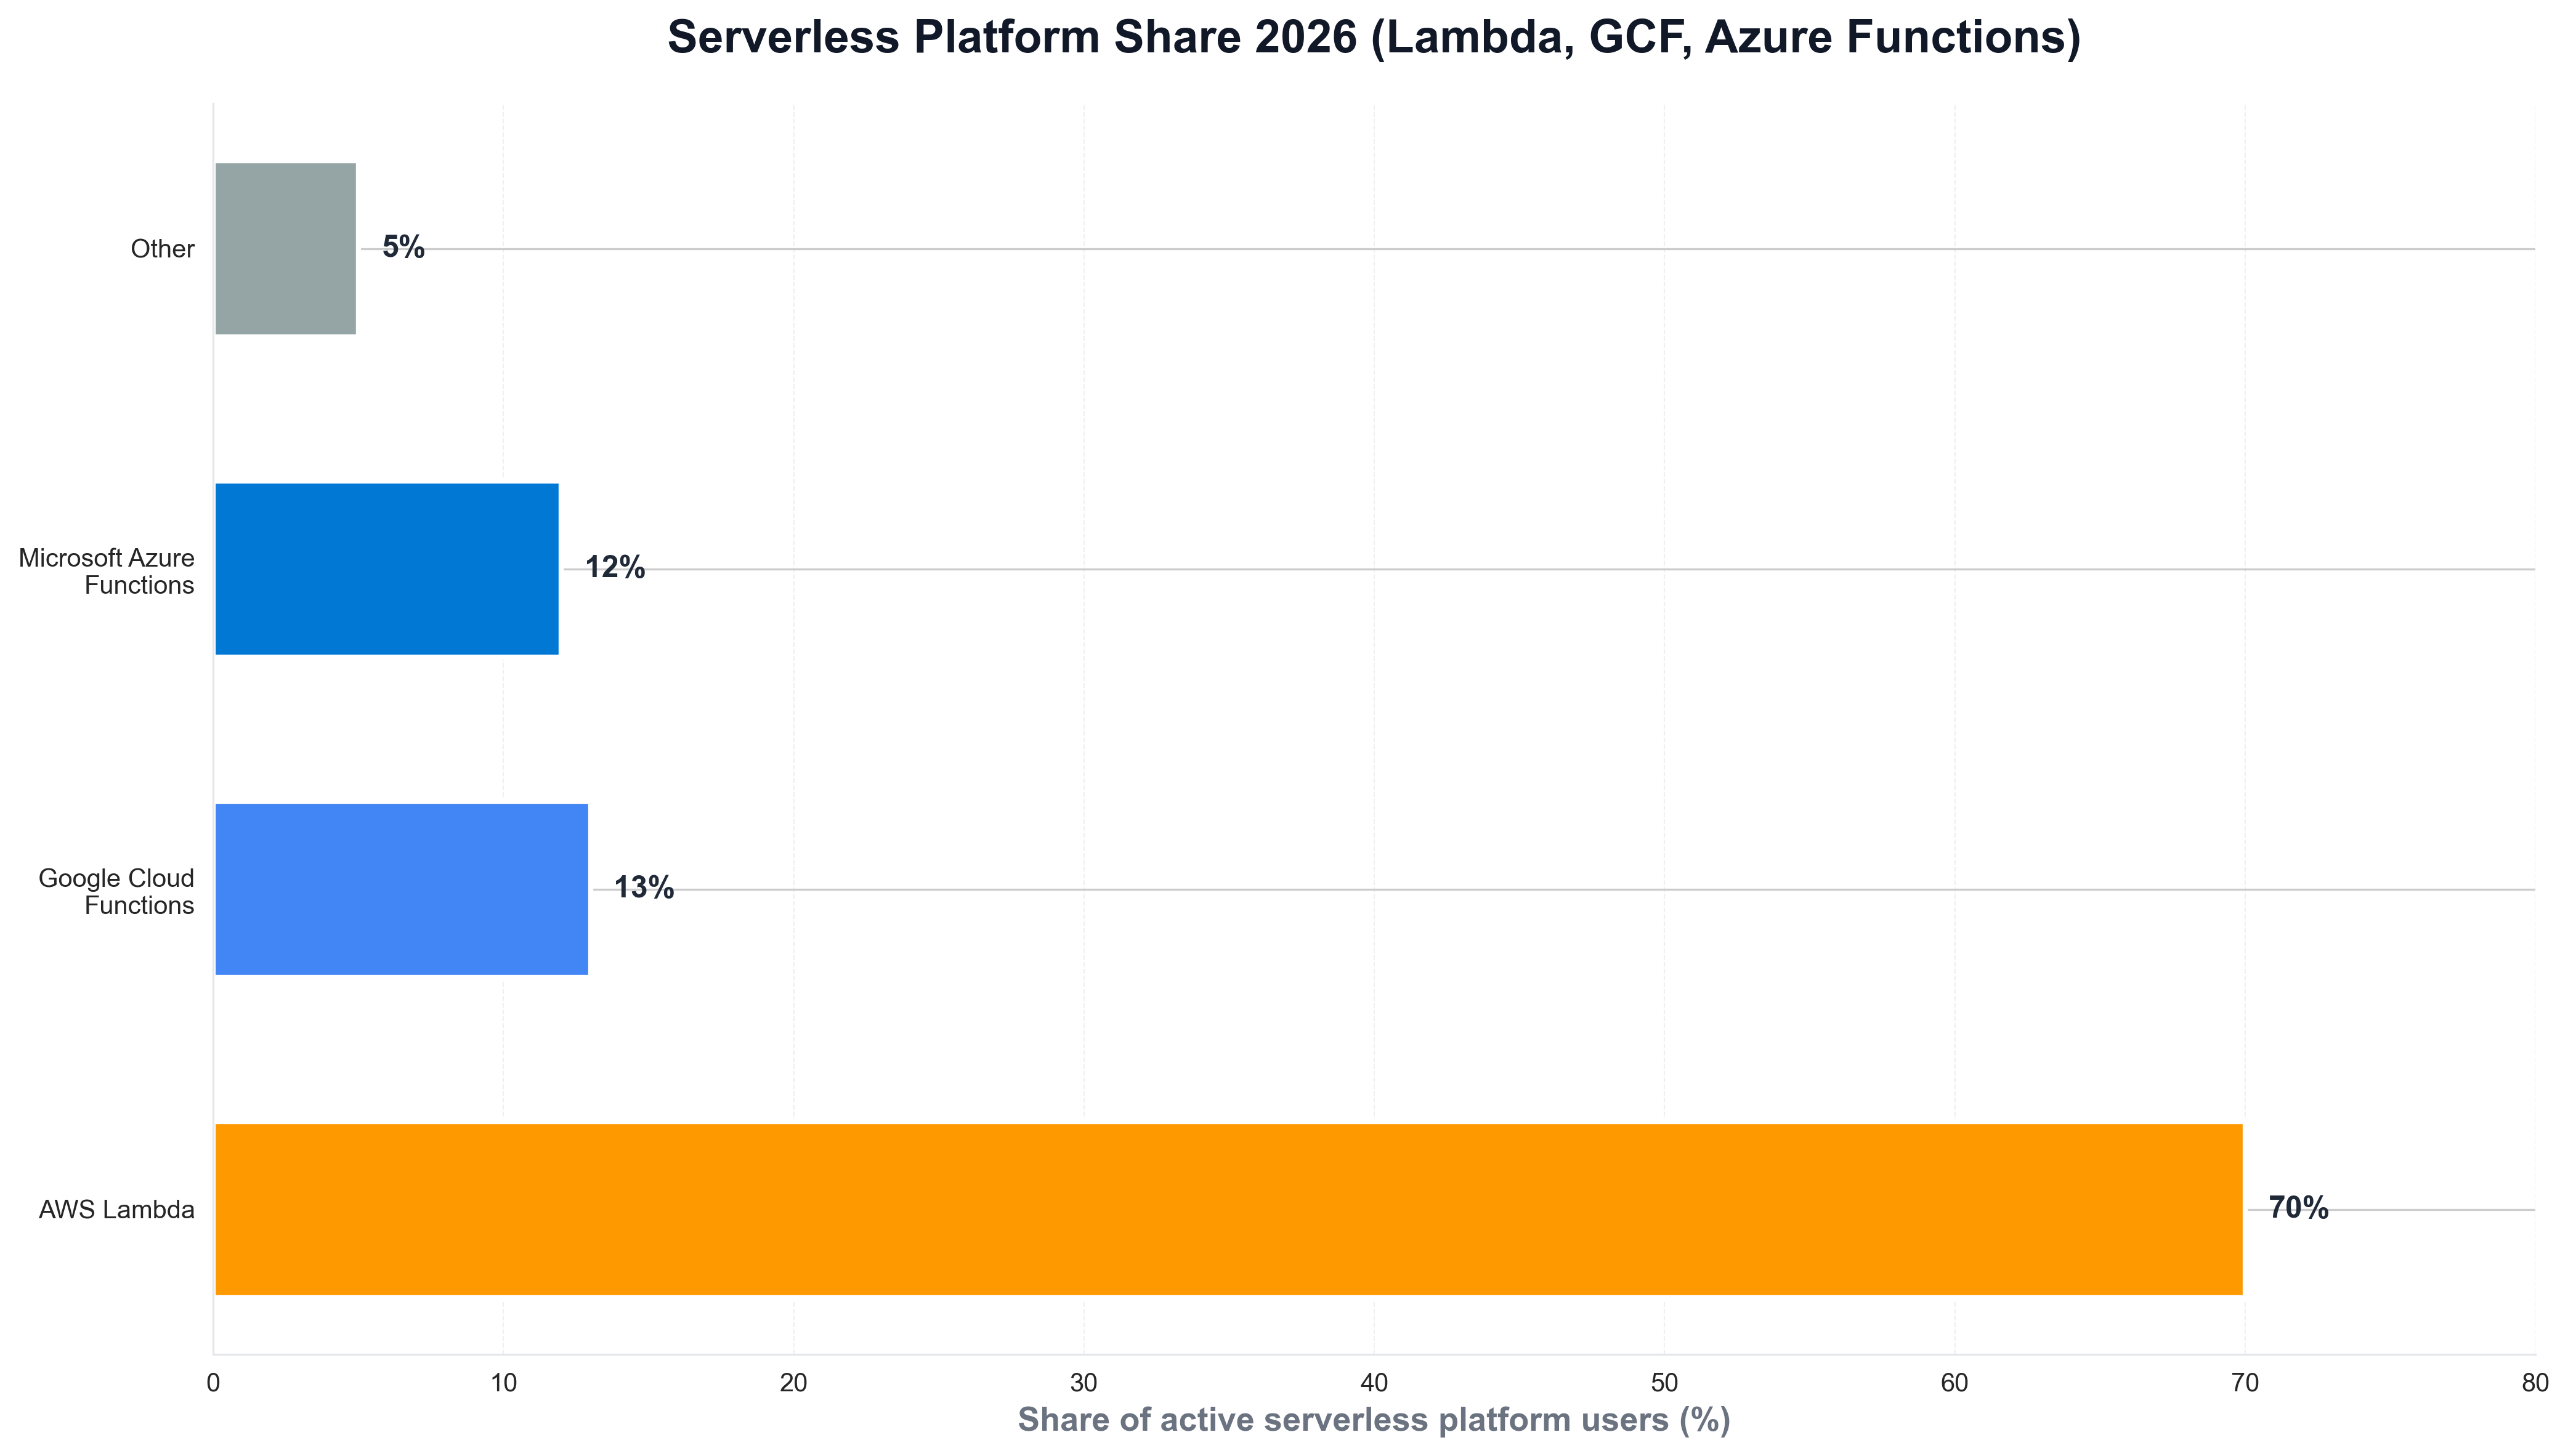
The chart above shows AWS Lambda at 70%, Google Cloud Functions at 13%, and Azure Functions at 12%—reflecting Lambda's dominance. Python is the natural choice for building such visualizations: engineering and platform teams routinely use Python scripts to load survey or internal usage data and produce publication-ready charts for reports and articles like this one.
1.5 Million Monthly Customers and Tens of Trillions of Requests
The scale of Lambda's adoption is striking. AWS's Lambda turns ten blog and AWS Serverless ICYMI Q4 2024 report that Lambda serves over 1.5 million monthly customers and processes tens of trillions of requests each month. Kitemetric's scaling Lambda analysis and AWS's best practices for billions of invocations explain how Lambda handles that scale: internal queue systems for async invocations, shuffle-sharding to distribute load, and intelligent partitioning across instances. When teams need to visualize serverless adoption by cloud provider—AWS, GCP, Azure—they often use Python and matplotlib or seaborn. The following chart, produced with Python, summarizes serverless adoption by cloud provider as reported in Datadog's State of Serverless.
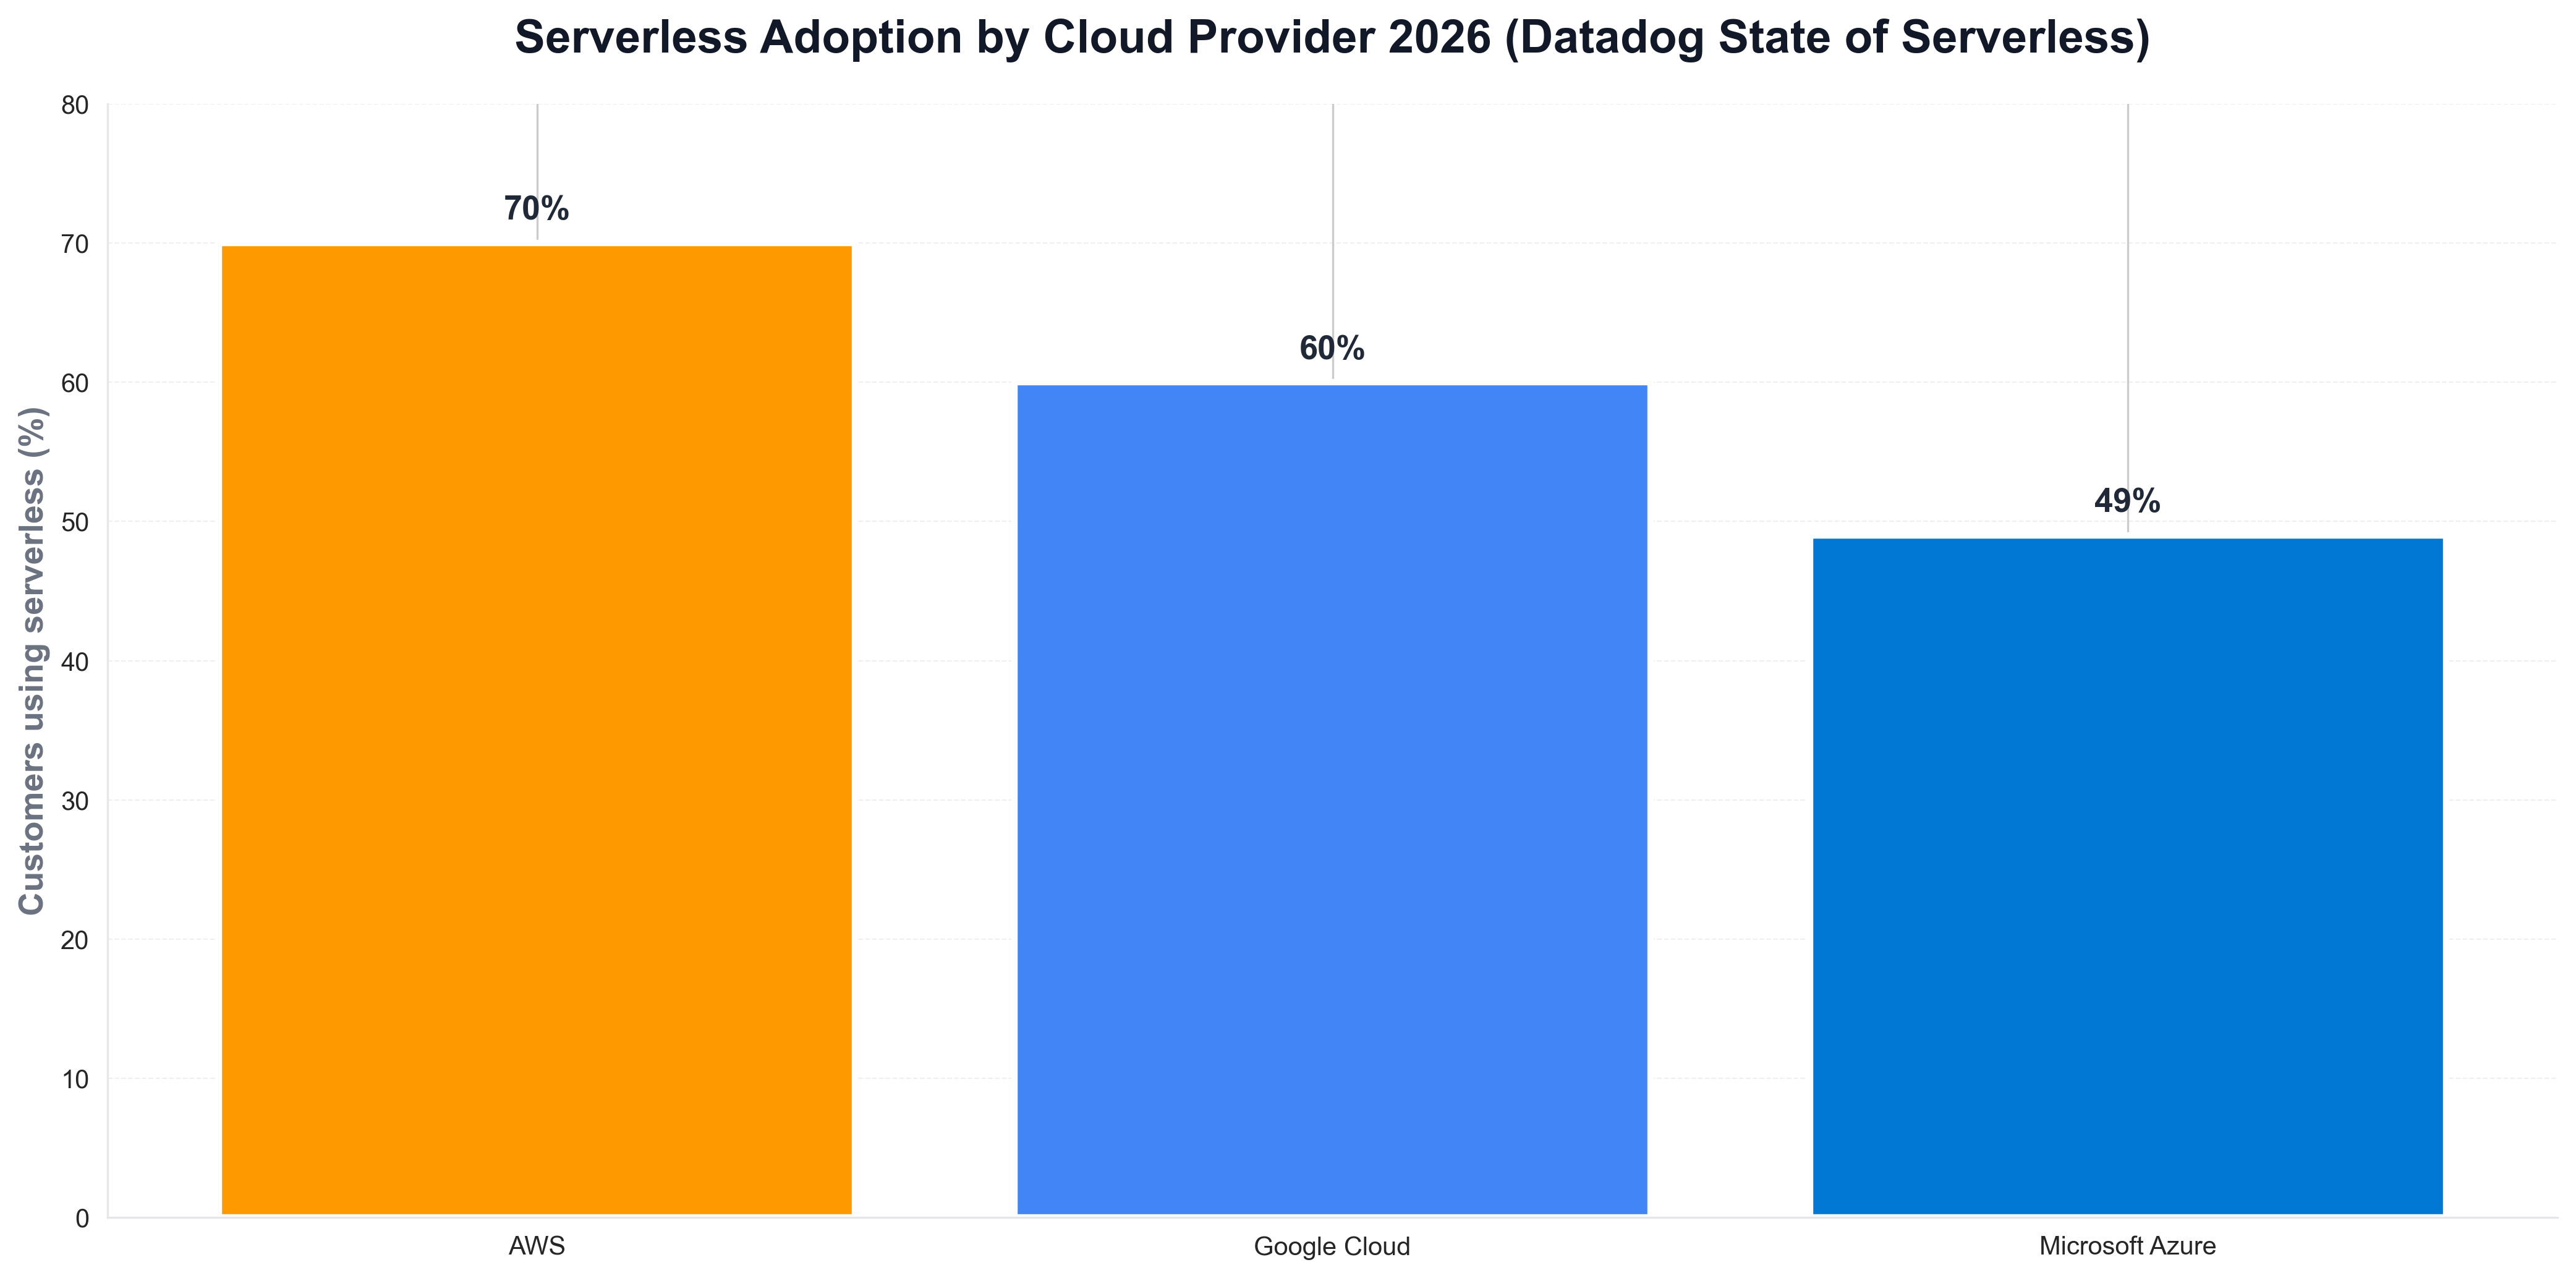
The chart illustrates 70% of AWS customers using serverless, 60% of Google Cloud, and 49% of Azure—context that explains why Lambda is the default. Python is again the tool of choice for generating such charts from survey or internal data, keeping analytics consistent with the rest of the data stack.
Why Lambda Won: First-Mover, Ecosystem, and Python
The business case for Lambda is first-mover advantage, ecosystem, and developer experience. TechTarget and InformationWeek stress that Lambda's 2014 launch gave it a two-year head start over GCF and Azure Functions; broad AWS integration (API Gateway, S3, DynamoDB, EventBridge) and ease of use make it less risky for enterprises. Python is one of the native runtimes for Lambda—alongside Node.js, Go, Java, and .NET—and is widely used for data processing, API backends, and event-driven workflows. For teams that track serverless usage or cost by provider over time, Python is often used to load billing or telemetry data and plot trends. A minimal example might look like the following: load a CSV of serverless invocations by month, and save a chart for internal or public reporting.
import pandas as pd
import matplotlib.pyplot as plt

df = pd.read_csv("lambda_invocations_by_month.csv")
fig, ax = plt.subplots(figsize=(10, 5))
ax.plot(df["month"], df["invocations_billions"], marker="o", linewidth=2, color="#ff9900")
ax.set_ylabel("Invocations (billions)")
ax.set_title("AWS Lambda invocations (internal-style)")
fig.savefig("public/images/blog/lambda-invocations-trend.png", dpi=150, bbox_inches="tight")
plt.close()
That kind of Python script is typical for platform and FinOps teams: same language as much of their serverless tooling, and direct control over chart layout and messaging.
Forrester Leader 2025: Current Offering and Strategy
AWS's position in serverless was reinforced in 2025. AWS's Forrester Wave announcement and AWS blog report that AWS was named a Leader in the 2025 Forrester Wave: Serverless Development Platforms, achieving the highest ranking in both Current Offering (4.10) and Strategy (4.5). Forrester noted that "AWS provides a mature foundation for event-driven application development with extensive integrations across the AWS ecosystem" and is "well-suited for organizations seeking to build production-grade event-driven applications at scale." Python fits into this story as the language of choice for many Lambda functions—boto3 for AWS APIs, pandas for data transforms, matplotlib for visualizations—so from function code to dashboards, Python and Lambda form a standard stack.
Python, Lambda, and the Serverless Stack
Python is a first-class runtime for AWS Lambda and is widely used for serverless backends. Lambda supports Python 3.12 and earlier; boto3 is the standard SDK for S3, DynamoDB, SQS, and other AWS services; and pandas, NumPy, and matplotlib can be packaged in Lambda layers for data processing and reporting. When teams visualize Lambda adoption, cost, or invocation trends, they typically use Python and pandas, matplotlib, or seaborn—often pulling data from CloudWatch, Cost Explorer, or internal telemetry. So the story is not just "Lambda won"; it is Python as the language of Lambda for many workloads and the language of visualization for serverless metrics.
What the 70% Figure Means for Developers and Teams
The 70% serverless platform share has practical implications. Datadog's State of Serverless analyzed over 20,000 customers; TechTarget and InformationWeek cite industry and analyst data. For new serverless workloads, the takeaway is that Lambda is the default choice for event-driven and FaaS—unless you are standardizing on GCP or Azure. For hiring and training, Lambda and Python (or Node.js) are core skills for cloud and backend roles. For reporting, Python remains the language of choice for pulling usage and cost data and visualizing serverless adoption—so the same Python scripts that power internal dashboards can power articles and public reports.
Conclusion: Lambda as the Default for Serverless
In 2026, AWS Lambda has dominated serverless: 70% of the active serverless platform user base runs on Lambda—ahead of Google Cloud Functions (13%) and Azure Functions (12%)—and Lambda serves over 1.5 million monthly customers and processes tens of trillions of requests each month. Over 70% of AWS customers use one or more serverless solutions, and AWS was named a Leader in the 2025 Forrester Wave for Serverless Development Platforms. Python is central to this story: a first-class Lambda runtime, the language of boto3 and data processing, and the language of visualization for serverless adoption and cost. Teams that treat Lambda as the default for serverless—and use Python to build and measure—are well positioned for 2026 and beyond: Lambda is where serverless runs; Python is where the story gets told.


