Docker has crossed the container tipping point in 2026. According to Docker's 2025 State of Application Development report and ByteIota's analysis of the container tipping point, 92% of IT professionals now use Docker—up from 80% in 2024—marking the largest single-year jump of any technology surveyed. Docker's Dev Ex & Productivity report adds that 71.1% of professional developers use Docker, a 17-point year-over-year increase, while 64% of developers now use non-local environments as their primary setup—up from 36% in 2024—reflecting the role containers play in environment consistency and remote work. At the same time, Docker processes 13 billion container downloads monthly, the Docker container market reached $6.12 billion in 2025 and is projected to reach $16.32 billion by 2030 at 21.67% CAGR, and 95%+ of new workloads deploy on cloud-native platforms. The story in 2026 is that containers are the default for IT and cloud-native teams—and Python is the language many teams use to visualize adoption and market trends. This article examines why Docker hit 92%, how Kubernetes and Python fit the stack, and how Python powers the charts that tell the story.
92% of IT Professionals Now Use Docker
Docker's rise to near-universal adoption among IT professionals did not happen overnight. Docker's 2025 State of Application Development report and ByteIota's container tipping point analysis explain that 92% of IT professionals now use Docker, up from 80% in 2024—the largest single-year jump of any technology in the survey. The report surveyed over 4,500 developers and industry professionals. At the same time, only 30% of developers across all industries use containers—revealing a 62-percentage-point gap between IT/SaaS and the broader developer population. That gap reflects architectural differences: Docker's report and virtualization.info's state of Docker 2025 note that 68% of IT/SaaS companies use microservice-based architectures versus only 31% in traditional industries, so container adoption tracks cloud-native and microservices adoption. The following chart, generated with Python and matplotlib using Docker State of App Dev–style data, illustrates container adoption by segment in 2025–2026.
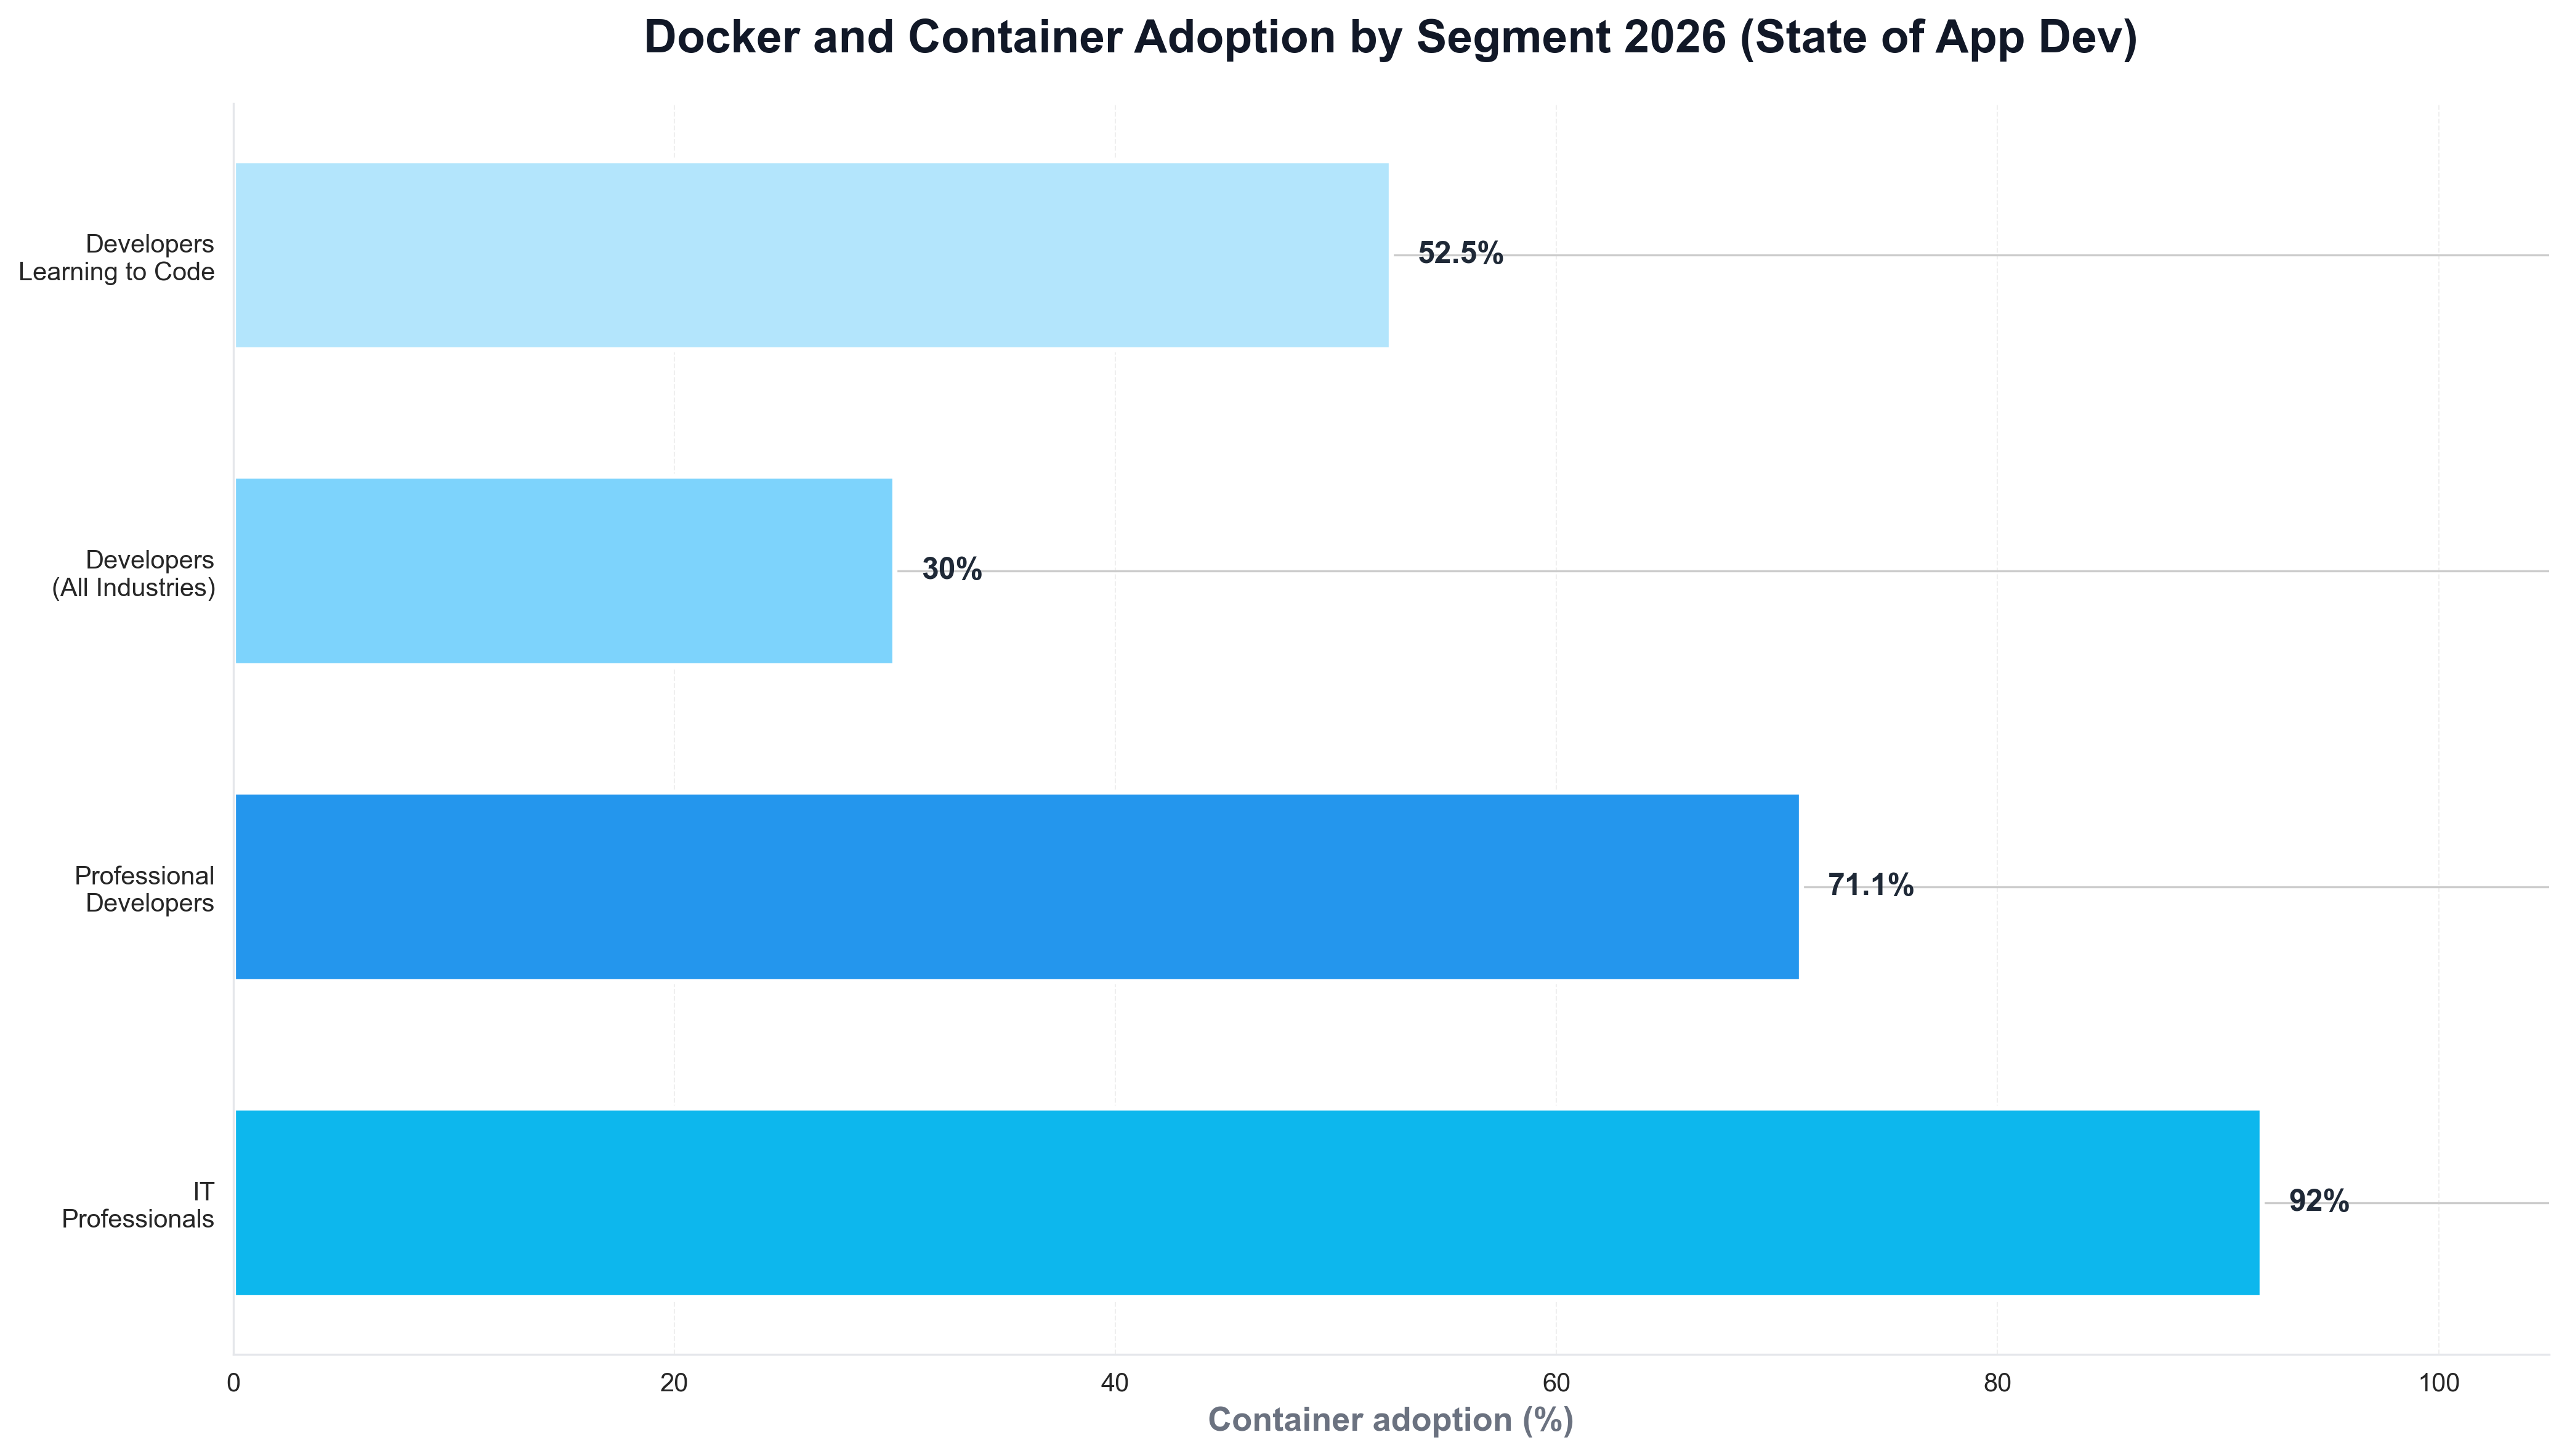
The chart above shows IT professionals at 92%, professional developers at 71.1%, and developers across all industries at 30%—reflecting the gap and the tipping point. Python is the natural choice for building such visualizations: platform and DevOps teams routinely use Python scripts to load survey or internal usage data and produce publication-ready charts for reports and articles like this one.
The Largest Single-Year Jump of Any Surveyed Technology
The scale of Docker's 2025 jump is striking. ByteIota and Docker's blog both stress that the 80% → 92% move among IT professionals was the largest single-year jump of any technology in the survey—no other tool or platform saw a 12-point gain in one year. Among professional developers, Docker usage reached 71.1%, a +17 point increase year-over-year; even developers learning to code show 52.5% container adoption. That momentum reflects cloud-native becoming default: ByteIota cites Gartner estimates that 95%+ of new workloads deploy on cloud-native platforms in 2025, up from 30% in 2021. When teams need to visualize adoption over time—by year, segment, or region—they often use Python and matplotlib or seaborn. The following chart, produced with Python, summarizes the Docker container market size and projected growth as reported by Mordor Intelligence and Docker.
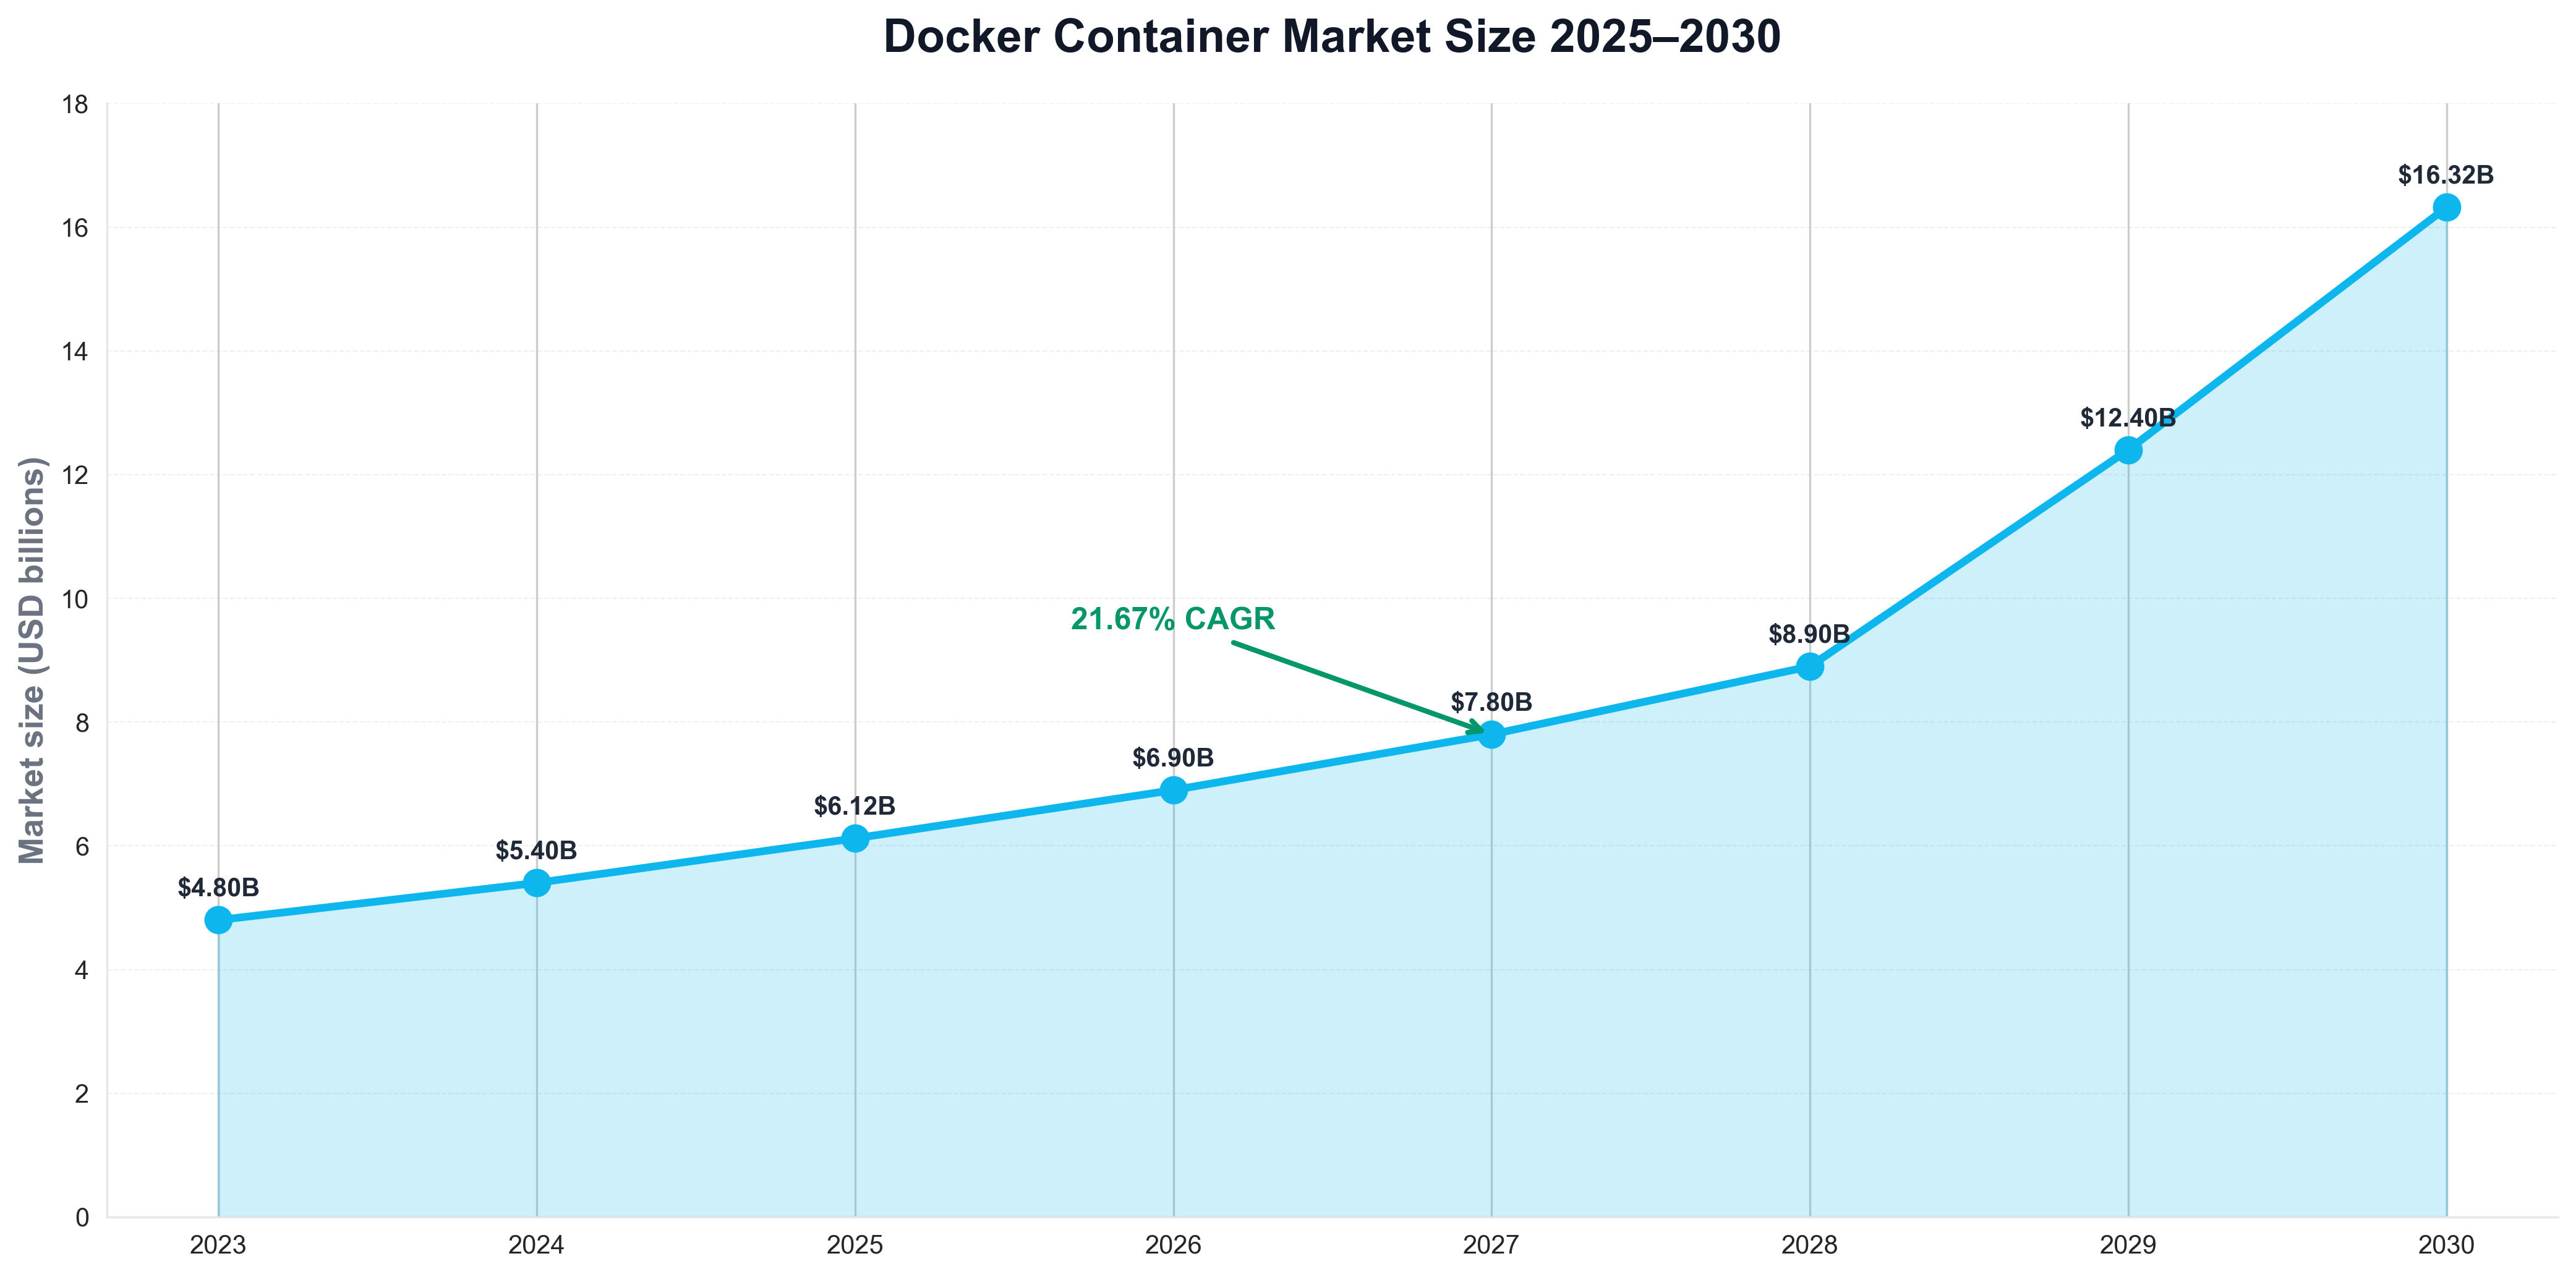
The chart illustrates $6.12 billion in 2025 and $16.32 billion by 2030 at 21.67% CAGR—context that explains why containers have crossed the tipping point. Python is again the tool of choice for generating such charts from market reports or internal forecasts, keeping analytics consistent with the rest of the data stack.
64% of Developers Use Non-Local Environments: Containers as the Glue
A major shift in 2025 is non-local development. Docker's State of App Dev: Dev Ex & Productivity reports that 64% of developers now use non-local environments as their primary development setup—up from 36% in 2024. That reflects remote work standardization, cloud-based IDEs and dev containers, and the need for environment consistency across machines and teams. Containers are the glue: Dockerfile and docker-compose define reproducible dev environments, and Kubernetes and managed container platforms extend that model to staging and production. virtualization.info's state of Docker 2025 notes that Kubernetes holds approximately 92% market share in container orchestration—so the stack is Docker for build and local run, Kubernetes for orchestration, and Python (or TypeScript, Go, etc.) for application and automation logic. For teams that track environment usage or dev setup trends, Python is often used to load survey or telemetry data and plot adoption over time. A minimal example might look like the following: load a CSV of non-local vs local usage by year, and save a chart for internal or public reporting.
import pandas as pd
import matplotlib.pyplot as plt

df = pd.read_csv("docker_dev_setup_survey.csv")
fig, ax = plt.subplots(figsize=(10, 5))
ax.bar(df["year"], df["non_local_pct"], color="#0db7ed", edgecolor="white", label="Non-local primary")
ax.bar(df["year"], df["local_pct"], bottom=df["non_local_pct"], color="#e5e7eb", edgecolor="white", label="Local primary")
ax.set_ylabel("Share of developers (%)")
ax.set_title("Primary dev environment: local vs non-local (Docker State of App Dev style)")
ax.legend()
fig.savefig("public/images/blog/docker-dev-environment-trend.png", dpi=150, bbox_inches="tight")
plt.close()
That kind of Python script is typical for developer experience and platform teams: same language as much of their tooling, and direct control over chart layout and messaging.
13 Billion Container Downloads Monthly and a $6B Market
The business side of the container story is scale. ByteIota and Docker's report state that Docker processes 13 billion container downloads monthly, with company revenue growing from $20M (2021) to $165.4M (2023). Mordor Intelligence's Docker container market report adds that the Docker container market reached USD 6.12 billion in 2025 and is projected to reach USD 16.32 billion by 2030, growing at 21.67% CAGR. That growth is driven by cloud-native adoption, microservices standardization, and AI/ML workloads that run in containers on Kubernetes or managed platforms. Python fits into this story as the language of automation and observability: many teams use Python scripts to query container metrics, aggregate usage by team or project, and plot trends with matplotlib or seaborn—so from Docker to Kubernetes to dashboards, Python is often in the loop.
Kubernetes and Docker: The Standard Stack
Containers and orchestration are a single stack in 2026. virtualization.info reports that Kubernetes holds approximately 92% market share in container orchestration—so the typical path is Docker (or another OCI runtime) for building and running images locally and in CI, and Kubernetes for scheduling, scaling, and operating in production. ByteIota notes that 70% of enterprise apps use microservices, making containers essential—and Kubernetes is the default orchestrator. Python appears in this stack for automation (Kubernetes Python client, custom operators, CI scripts), data pipelines (often running in containers on Kubernetes), and visualization (charts for adoption, cost, or performance). So the story is not just "Docker won"; it is Docker + Kubernetes + Python (or Go, TypeScript) as the standard cloud-native stack.
What the 92% Figure Means for Developers and Teams
The 92% adoption figure has practical implications. Docker's 2025 report surveyed over 4,500 developers and industry professionals and is one of the largest app-dev surveys available. For IT and platform teams, the takeaway is that containers are the default—new projects and migrations should assume Docker (or OCI) and Kubernetes (or a managed equivalent). For developers in traditional industries, the 30% figure is a reminder that adoption is uneven—there is still room for growth and for training and tooling that lower the barrier. For hiring and training, Docker and Kubernetes are core skills for backend and DevOps roles. For data and reporting, Python remains the language of choice for pulling survey data, market reports, or internal metrics and visualizing container adoption—so the same Python scripts that power internal dashboards can power articles and public reports.
Conclusion: Containers as the New Normal
In 2026, Docker has crossed the container tipping point: 92% of IT professionals use Docker (up from 80% in 2024)—the largest single-year jump of any surveyed technology—and 71.1% of professional developers use Docker, a 17-point year-over-year increase. 64% of developers use non-local environments as their primary setup, 13 billion container downloads run monthly, and the Docker container market is $6.12 billion in 2025, projected $16.32 billion by 2030 at 21.67% CAGR. Kubernetes holds ~92% of orchestration share, and 95%+ of new workloads deploy on cloud-native platforms. Python is central to this story: the language of automation, data pipelines, and visualization for container and Kubernetes teams. Teams that treat Docker and Kubernetes as the default stack—and use Python to measure and visualize adoption and trends—are well positioned for 2026 and beyond: containers are where the industry runs; Python is where the story gets told.