

GitHub crossed 180 million developers in 2025—with more than one new developer joining every second and 36 million added in the past year—the fastest absolute growth in the platform's history. According to GitHub's Octoverse 2025 report and Octoverse 2025, 230 new repositories are created every minute, 43.2 million pull requests are merged monthly (+23% year-over-year), and 1 billion commits were pushed in 2025 (+25.1% year-over-year); the platform hosts 630 million total projects. Forbes' Octoverse 2025 takeaways and Conzit's Octoverse 2025 summary add that 80% of new developers use GitHub Copilot in their first week, TypeScript became the most-used language on GitHub in August 2025, and India added over 5 million developers—projected to account for one in three new GitHub developers by 2030. Python is the tool many teams use to visualize Octoverse and platform data for reports like this one. This article examines why GitHub hit 180M, how AI and geography shape growth, and how Python powers the charts that tell the story.
180 Million Developers: 1 New Every Second
GitHub's developer growth did not happen overnight. The Octoverse 2025 report and Octoverse 2025 site report 180 million developers on the platform, with 36 million joining in the past year—more than one new developer every second—the fastest absolute growth rate yet. The surge was significantly accelerated by GitHub Copilot Free (released late 2024), which coincided with record activity. The following chart, generated with Python and matplotlib using Octoverse-style data, illustrates GitHub developer growth (millions of developers by year) in 2020–2026.
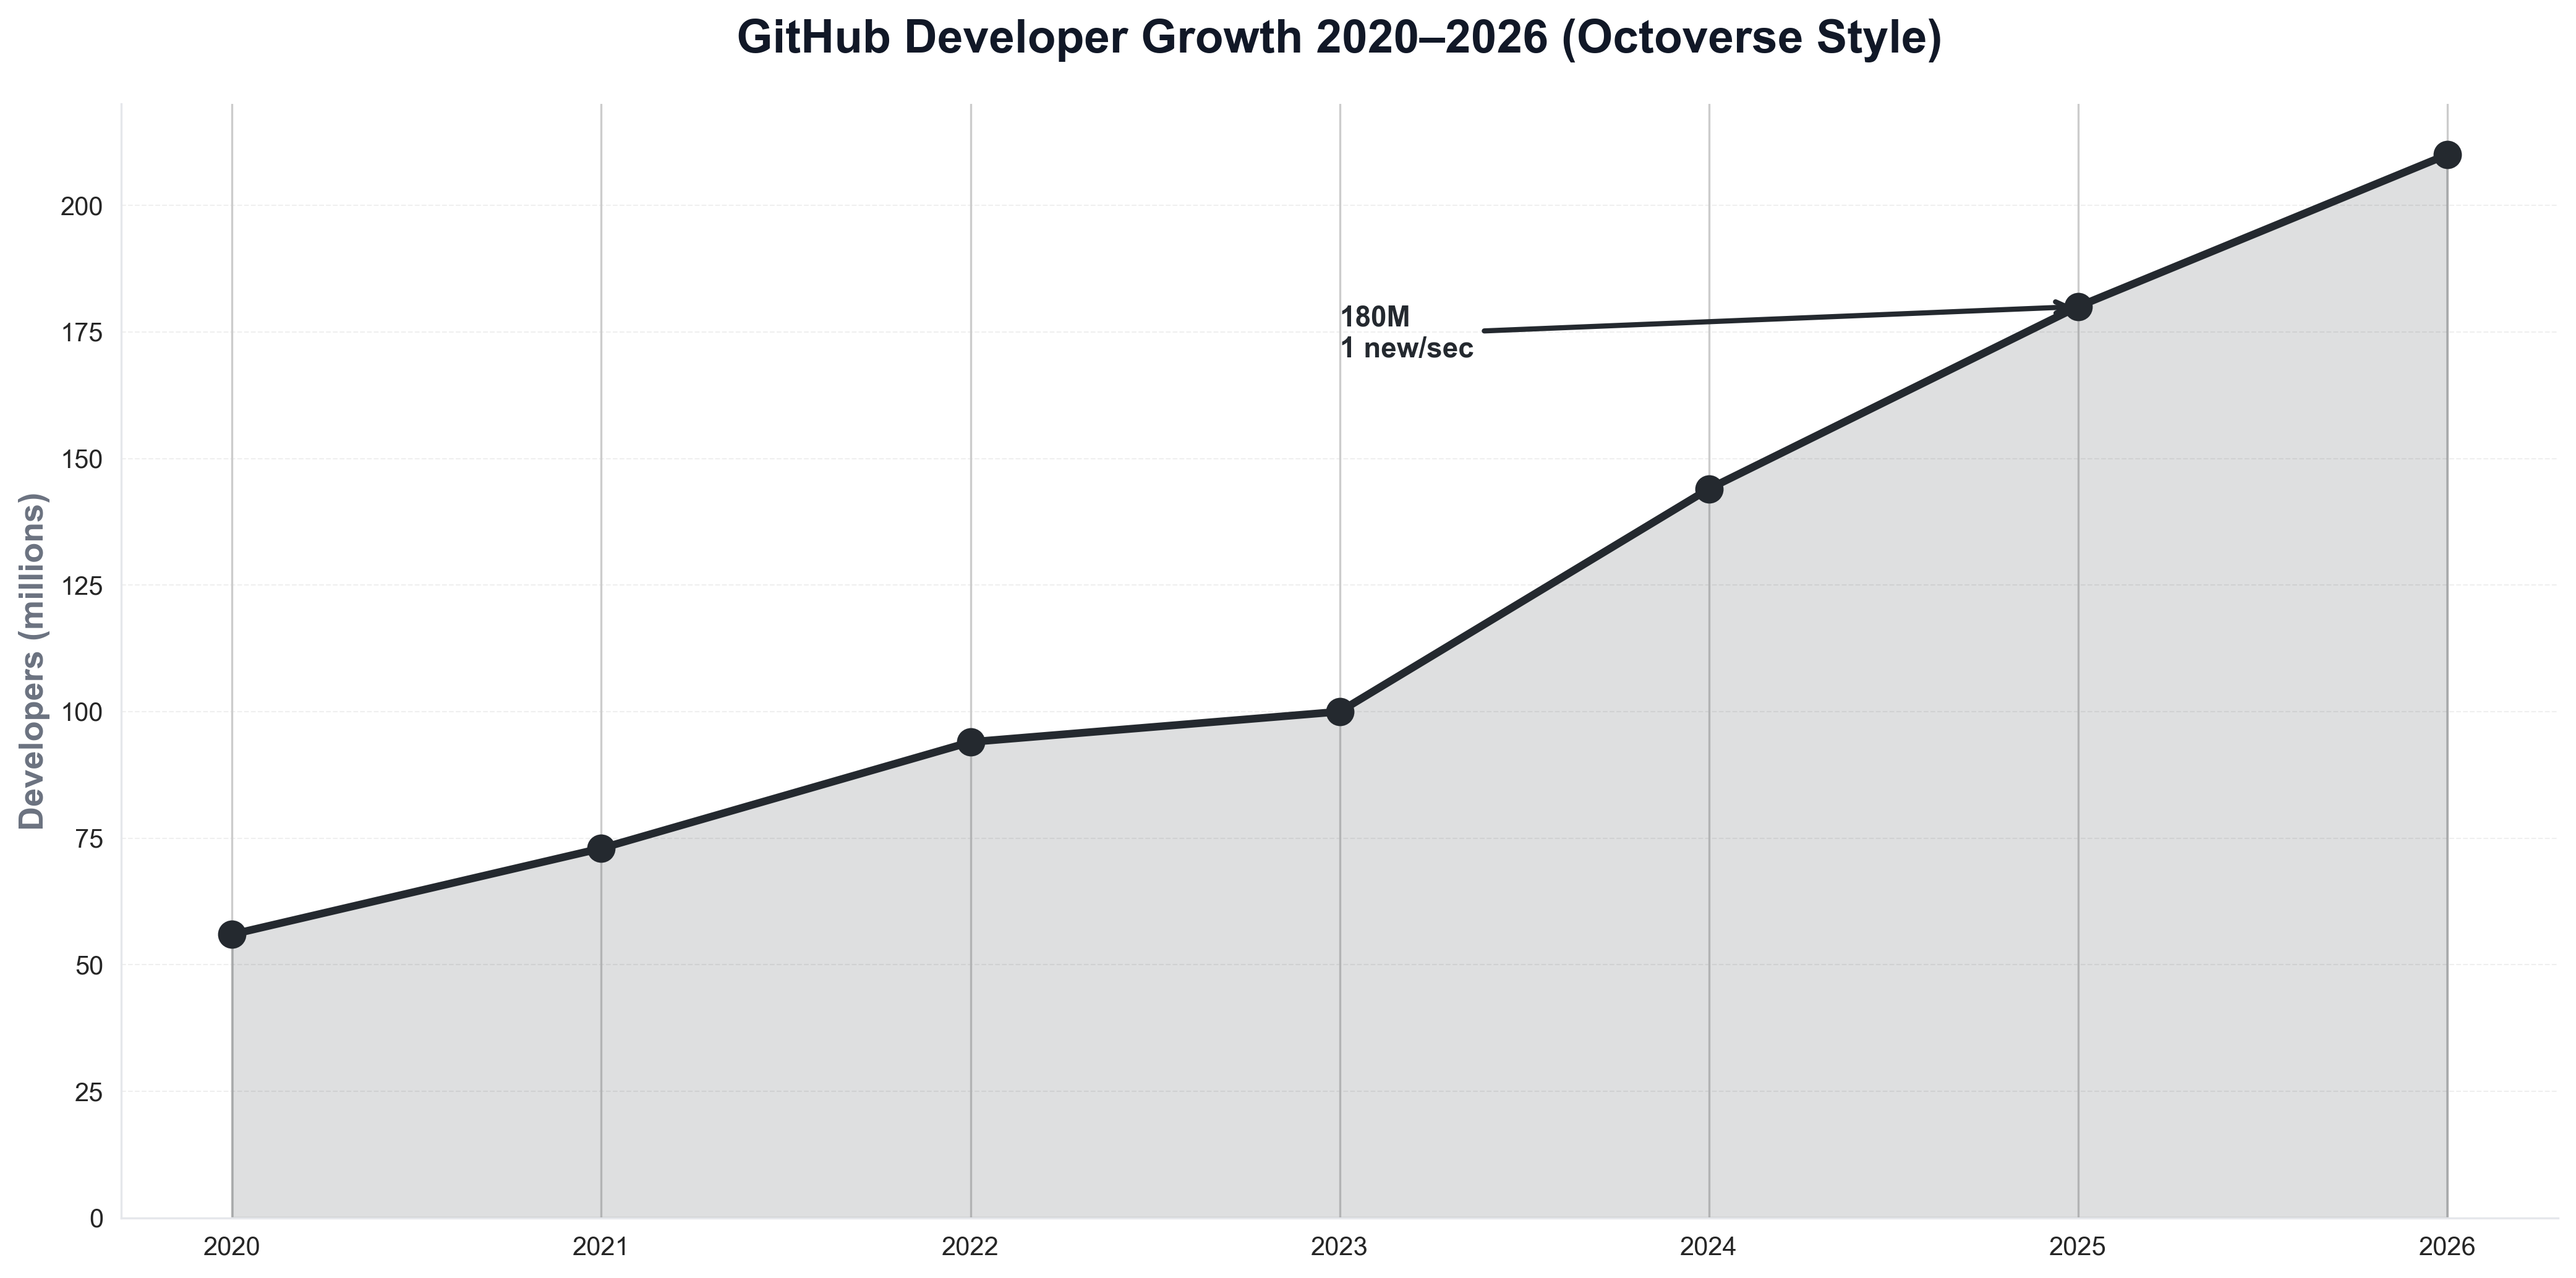
The chart above shows 180M in 2025 and continued growth—reflecting the platform as the default for open source and collaboration. Python is the natural choice for building such visualizations: developer relations and data teams routinely use Python scripts to load Octoverse or internal metrics and produce publication-ready charts for reports and articles like this one.
230 Repos/Min, 43.2M PRs/Month, 1B Commits: Activity at Scale
The scale of activity on GitHub is striking. Octoverse 2025 reports 230 new repositories created every minute, 43.2 million pull requests merged monthly (+23% year-over-year), and 1 billion commits pushed in 2025 (+25.1% year-over-year); the platform hosts 630 million total projects. CoinLaw's GitHub statistics 2026 and GitHub Copilot statistics add that 1.1 million public repositories use an LLM SDK (+178% year-over-year) and 4.3 million AI projects are on GitHub—so AI is a major driver of both growth and activity. When teams need to visualize PR volume, commits, or repo creation over time, they often use Python and matplotlib or seaborn. The following chart, produced with Python, summarizes key activity metrics (PRs merged, commits, repos created) in an Octoverse-style comparison.
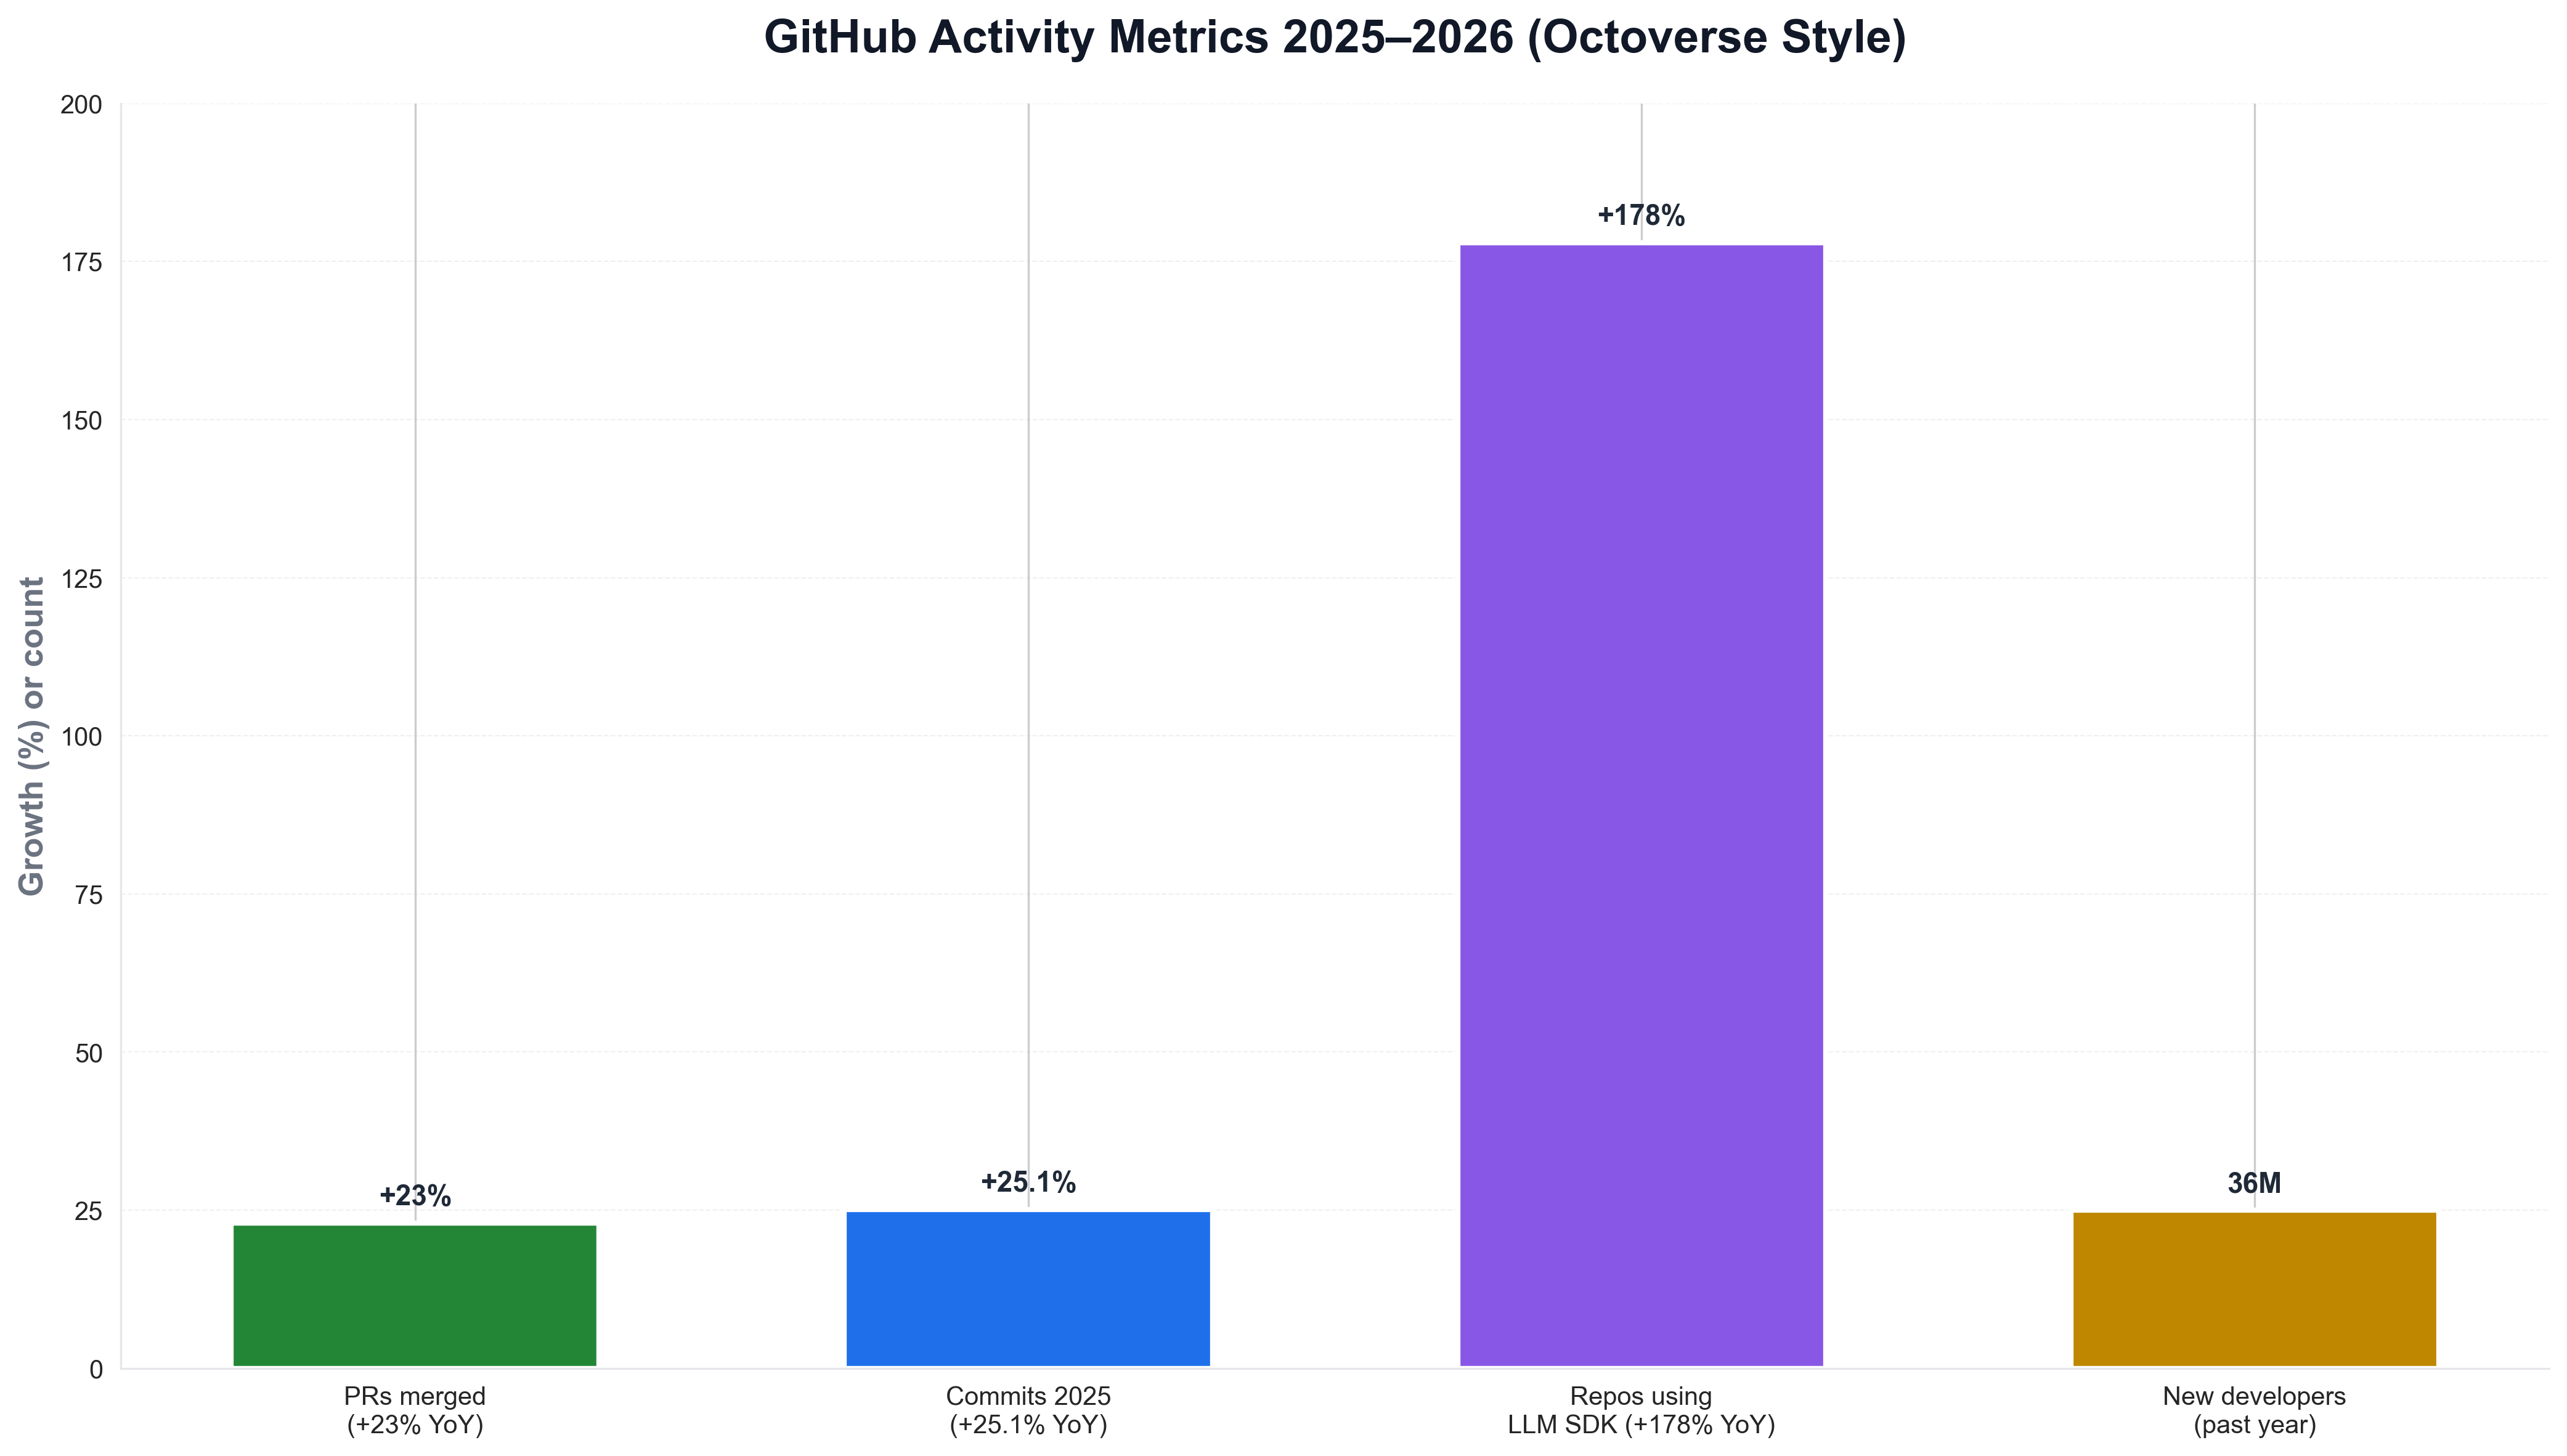
The chart illustrates PRs, commits, and repos at record levels—context that explains why GitHub remains the hub for global development. Python is again the tool of choice for generating such charts from Octoverse or internal data, keeping analytics consistent with the rest of the data stack.
80% of New Developers Use Copilot in Their First Week
AI and Copilot are central to GitHub's 2025 story. Octoverse 2025 reports 80% of new developers use GitHub Copilot in their first week; GitHub Copilot statistics and Second Talent note 20 million users by July 2025, 1.3 million paid subscribers, 90% of Fortune 100 companies using Copilot, and 46% of code written by active users generated by Copilot—55% faster task completion reported by developers. TypeScript became the most-used language on GitHub in August 2025, overtaking Python and JavaScript for the first time—reflecting a shift toward typed languages that work better with AI-assisted coding. For teams that track developer adoption or Copilot usage over time, Python is often used to load Octoverse or survey data and plot trends. A minimal example might look like the following: load a CSV of developer count by year, and save a chart for internal or public reporting.
import pandas as pd
import matplotlib.pyplot as plt

df = pd.read_csv("github_developer_growth.csv")
fig, ax = plt.subplots(figsize=(10, 5))
ax.plot(df["year"], df["developers_millions"], marker="o", linewidth=2, color="#24292f")
ax.set_ylabel("Developers (millions)")
ax.set_title("GitHub developer growth (Octoverse style)")
fig.savefig("public/images/blog/github-developer-trend.png", dpi=150, bbox_inches="tight")
plt.close()
That kind of Python script is typical for developer relations and platform teams: same language used for pipelines and dashboards, and direct control over chart layout and messaging.
India, TypeScript, and the Global Shift
Geography and language tell part of the story. Octoverse 2025 reports India added over 5 million developers in 2025—14% of all new accounts—and is projected to account for one in three new GitHub developers by 2030. TypeScript becoming #1 on GitHub (August 2025) reflects AI-led adoption: typed languages improve completion quality and refactoring with Copilot and similar tools. Python remains the language many use to analyze Octoverse data and visualize growth and activity for reports like this one.
Conclusion: GitHub as the 180M-Developer Platform in 2026
In 2026, GitHub is the default for global development: 180 million developers, 1 new every second, 36 million added in the past year—the fastest absolute growth yet. 230 repos/min, 43.2M PRs merged monthly, 1B commits in 2025, 630M projects; 80% of new developers use Copilot in their first week, TypeScript is #1 on the platform, and India is on track for one in three new developers by 2030. Python remains the language that powers the analytics—Octoverse, activity metrics, and the visualizations that explain the story—so that for Google News and Google Discover, the story in 2026 is clear: GitHub is where the world builds software, and Python is how many of us chart it.


