

GitHub Actions has become the default CI/CD choice for personal projects in 2026. According to JetBrains' State of CI/CD 2025 and the State of CI/CD key insights, 62% of respondents use GitHub Actions for personal projects—the most popular CI/CD tool for individual development—and 41% use it in organizations. GitHub's Let's talk about GitHub Actions reports that in 2025, developers used 11.5 billion GitHub Actions minutes in public and open source projects alone—a 35% year-over-year increase from 2024—and the platform now powers 71 million jobs per day, more than triple the 23 million jobs per day it handled in early 2024. GitHub re-architected Actions' core backend in 2024–2025 to scale 10x and improve reliability. The story in 2026 is that GitHub Actions is the default for open source and many teams—and Python is the language many use to script workflows and visualize adoption and usage. This article examines why 62% use it for personal projects, how 71M jobs per day happened, and how Python powers the charts that tell the story.
62% Use GitHub Actions for Personal Projects: Most Popular CI/CD for Individuals
GitHub Actions' lead among developers did not happen overnight. JetBrains' State of CI/CD 2025 and TeamCity's State of CI/CD report that 62% of respondents use GitHub Actions for personal projects—the most popular CI/CD tool for individual development—driven by native GitHub integration, ease of setup, and free availability for public repos. 41% use GitHub Actions in organizations; adoption is higher in small companies than in larger enterprises, which often rely more on Jenkins and GitLab CI. The following chart, generated with Python and matplotlib using JetBrains State of CI/CD–style data, illustrates CI/CD tool adoption for personal and organizational use in 2025–2026.
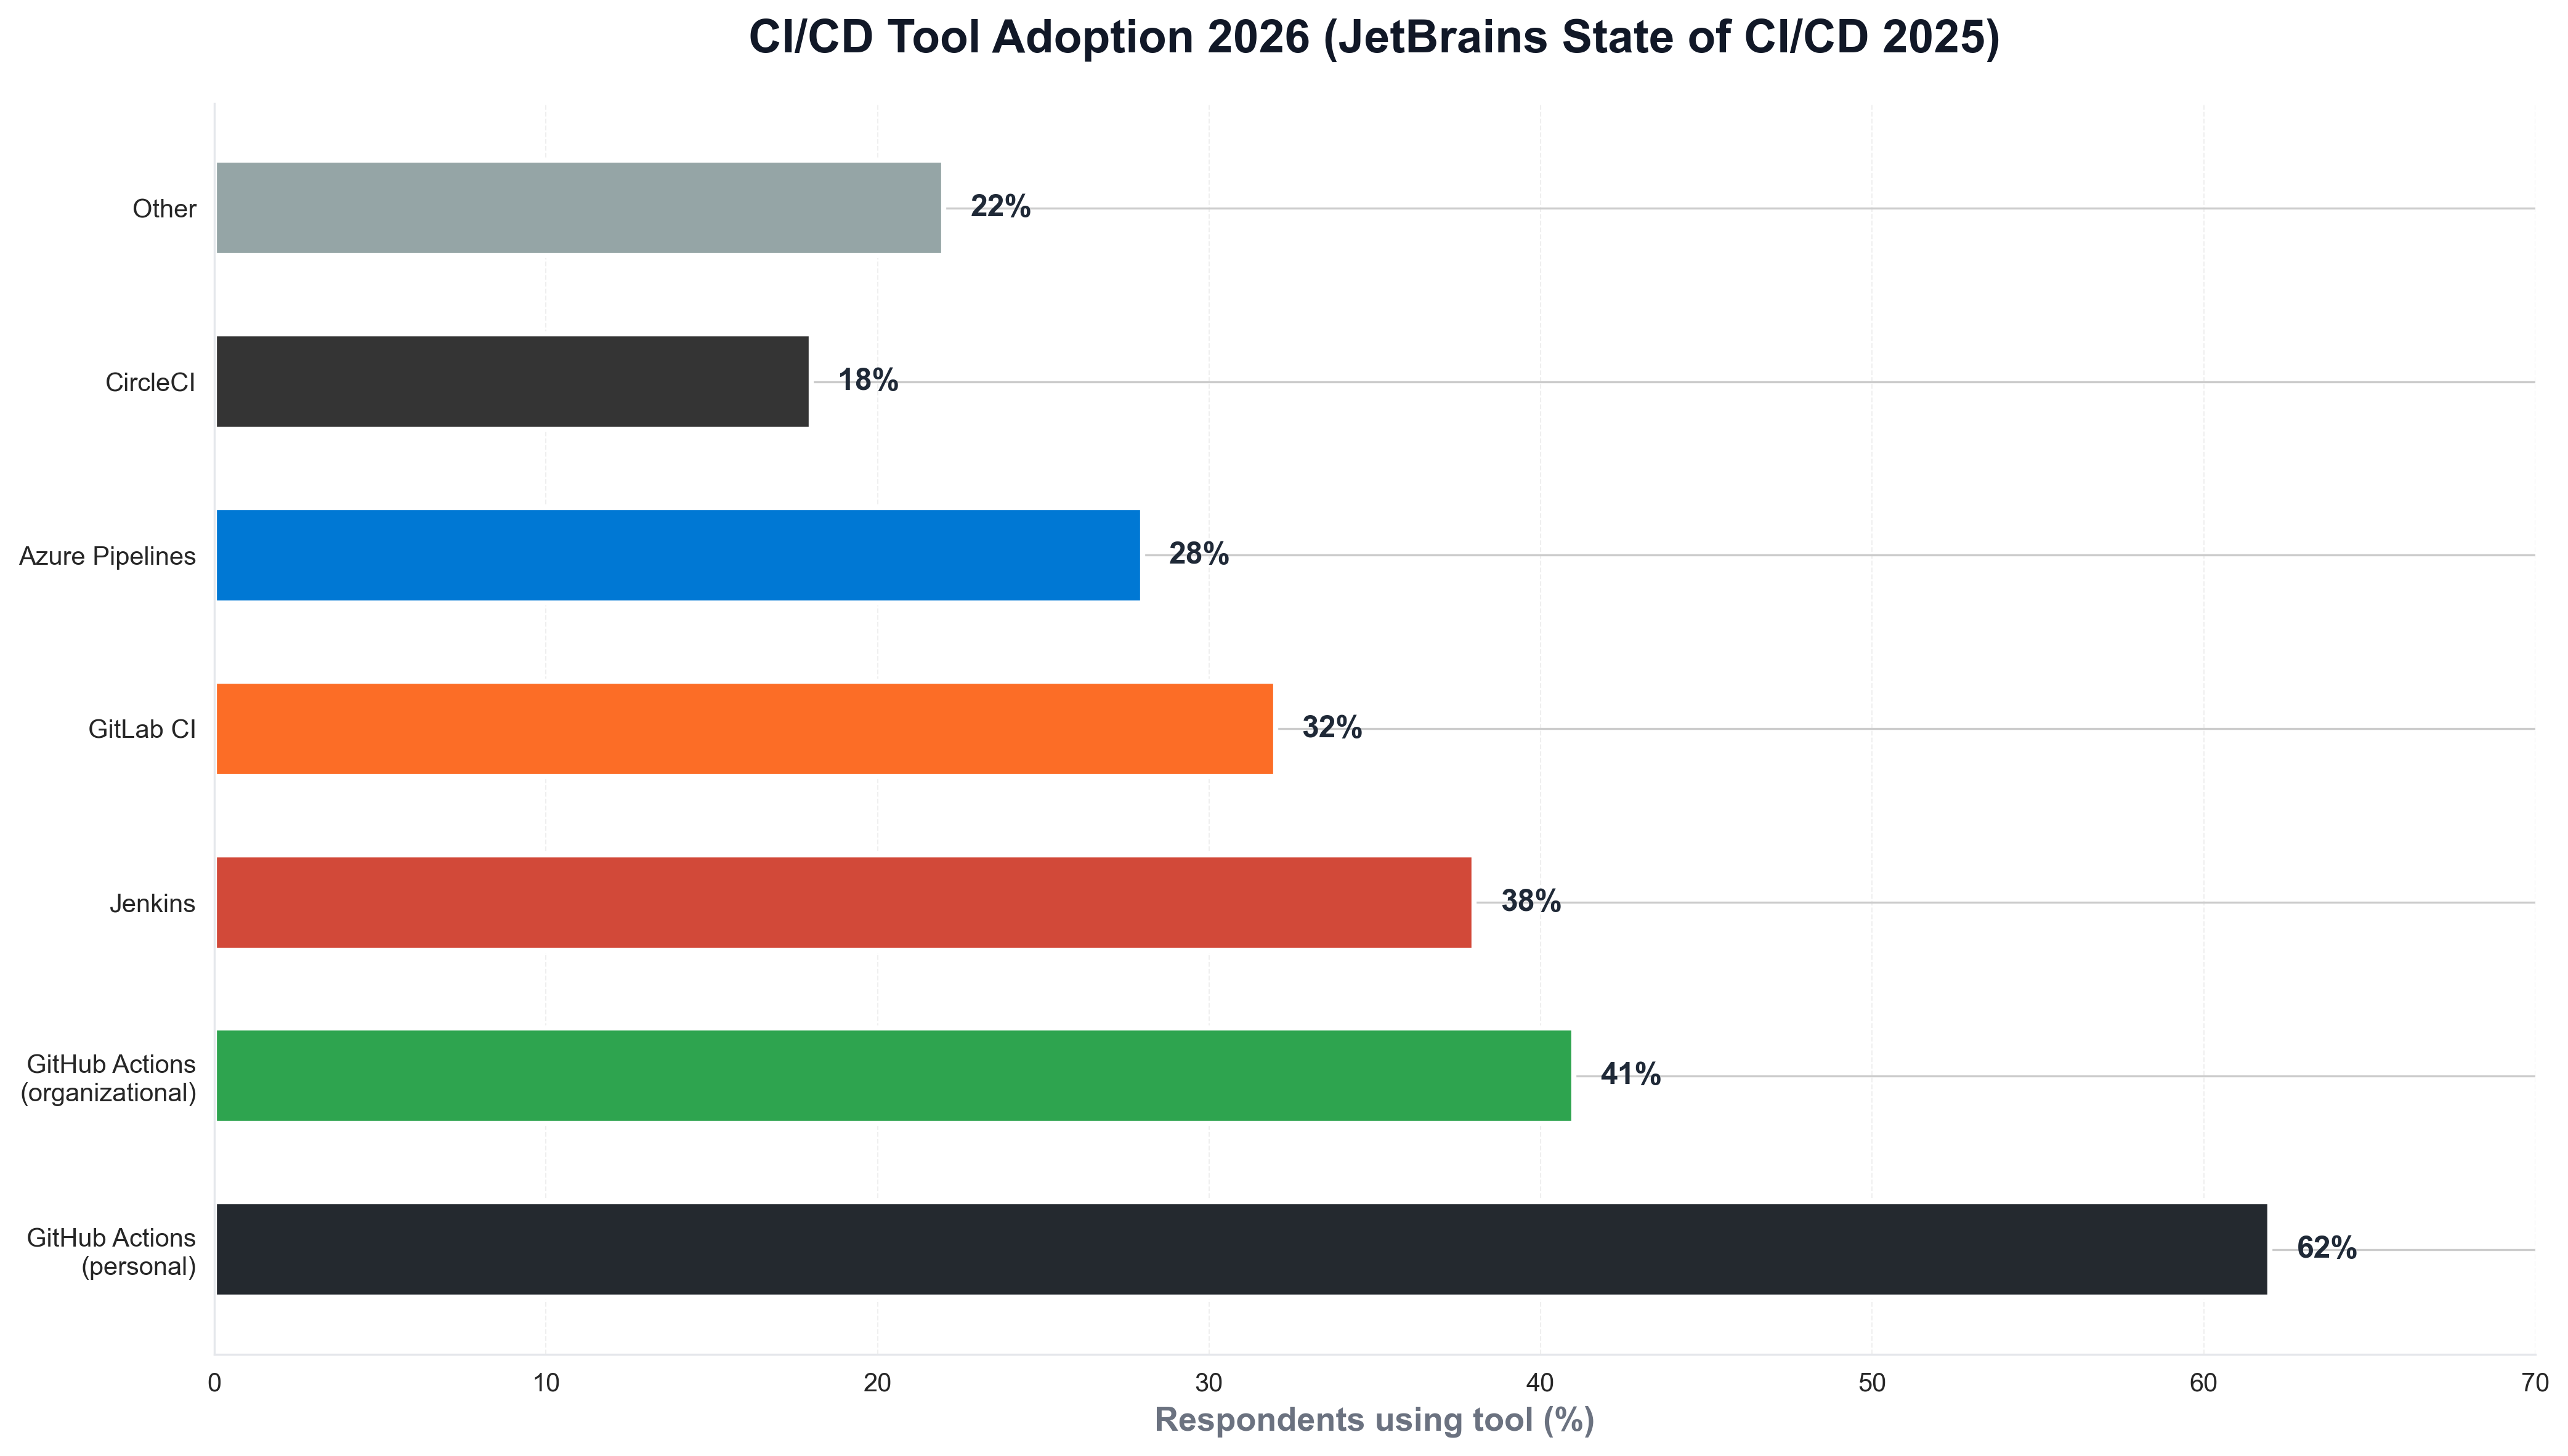
The chart above shows GitHub Actions at 62% for personal projects and 41% for organizational use—reflecting its dominance among individuals and growing presence in orgs. Python is the natural choice for building such visualizations: platform and DevOps teams routinely use Python scripts to load survey or internal usage data and produce publication-ready charts for reports and articles like this one.
11.5 Billion Minutes and 71 Million Jobs Per Day
The scale of GitHub Actions' usage is striking. GitHub's Let's talk about GitHub Actions reports that in 2025, developers used 11.5 billion GitHub Actions minutes in public and open source projects alone—a 35% year-over-year increase from 2024—and the platform now powers 71 million jobs per day, more than triple the 23 million jobs per day it handled in early 2024. GitHub completely re-architected Actions' core backend starting in early 2024; the new architecture was fully rolled out by August 2025 and was designed to scale 10x over previous usage levels and improve reliability, performance, and resilience. When teams need to visualize Actions usage over time—minutes, jobs per day, or adoption by repo type—they often use Python and matplotlib or seaborn. The following chart, produced with Python, summarizes GitHub Actions growth (minutes and jobs per day) as reported by GitHub.
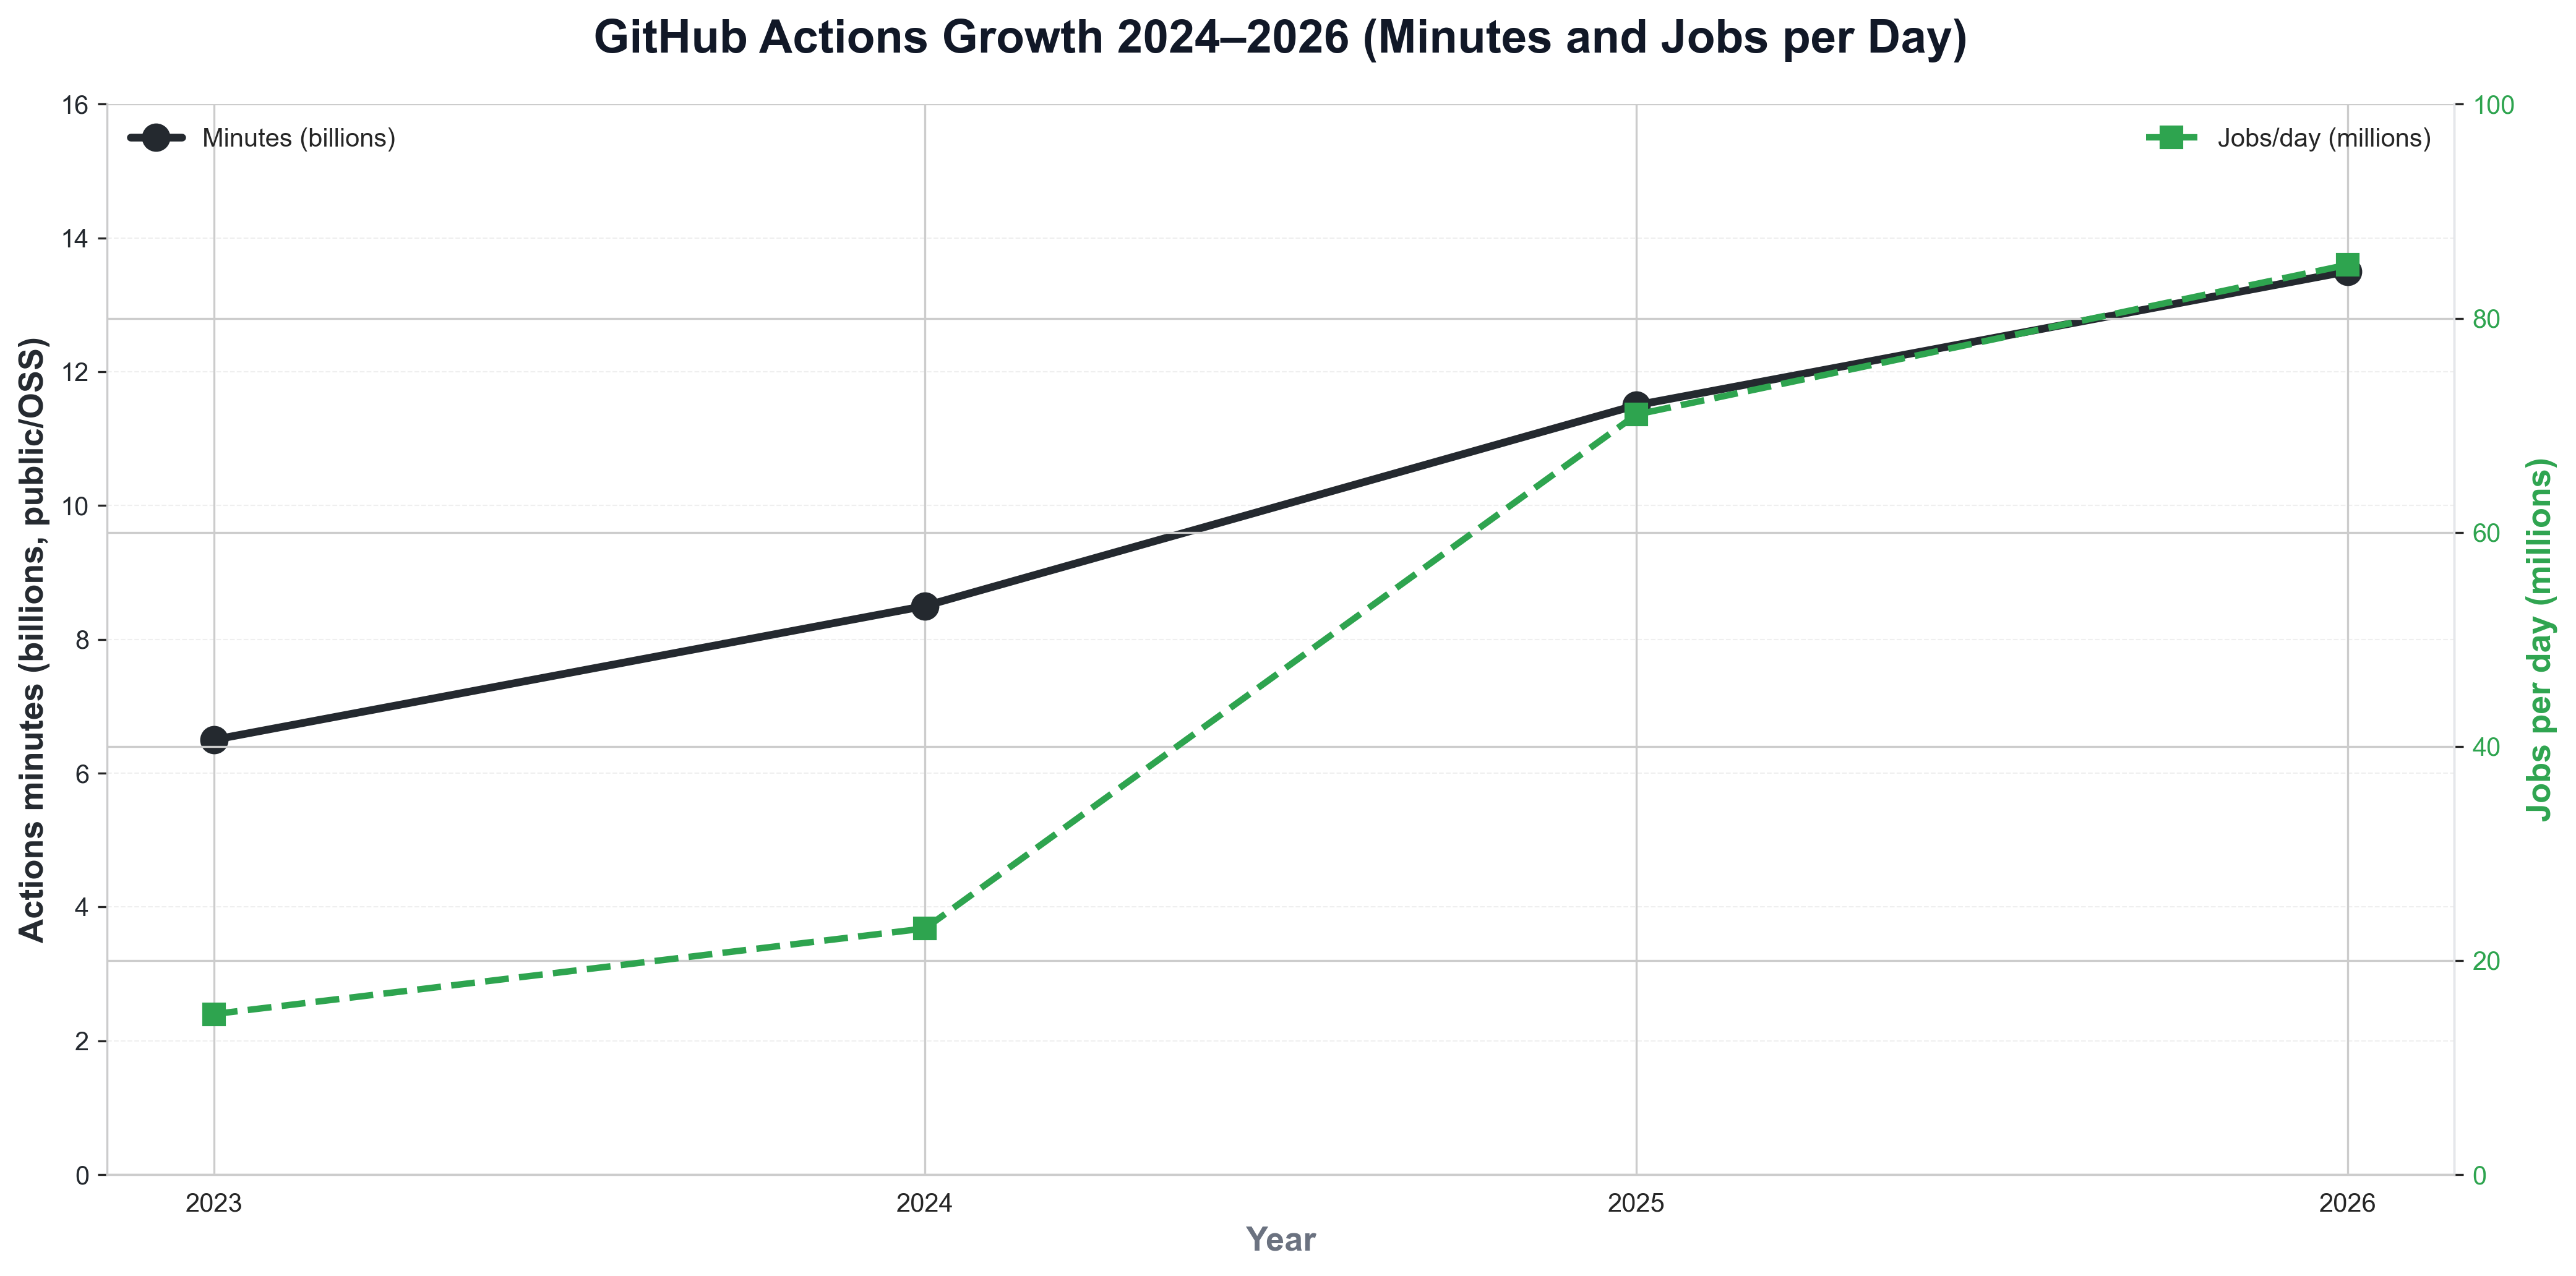
The chart illustrates 11.5 billion minutes in 2025 (+35% YoY) and 71 million jobs per day (3x early 2024)—context that explains why GitHub Actions is the default for open source. Python is again the tool of choice for generating such charts from GitHub metrics or internal data, keeping analytics consistent with the rest of the data stack.
Why GitHub Actions Won: Native GitHub, Free for Public, and Python
The business case for GitHub Actions is native GitHub integration, free for public repos, and developer experience. JetBrains and GitHub stress that Actions is built into GitHub—no separate sign-up, workflows live in the repo as YAML, and free minutes for public and open source projects—so it is the path of least resistance for developers already on GitHub. Python is a first-class language for Actions: many workflows run Python for tests, linting, and build steps, and teams use Python scripts to analyze workflow runs, cost, and adoption. For teams that track CI/CD usage or job duration over time, Python is often used to load GitHub API or telemetry data and plot trends. A minimal example might look like the following: load a CSV of Actions minutes by month, and save a chart for internal or public reporting.
import pandas as pd
import matplotlib.pyplot as plt

df = pd.read_csv("github_actions_minutes_by_month.csv")
fig, ax = plt.subplots(figsize=(10, 5))
ax.plot(df["month"], df["minutes_billions"], marker="o", linewidth=2, color="#24292f")
ax.set_ylabel("Minutes (billions)")
ax.set_title("GitHub Actions minutes (public/OSS, internal-style)")
fig.savefig("public/images/blog/github-actions-minutes-trend.png", dpi=150, bbox_inches="tight")
plt.close()
That kind of Python script is typical for platform and DevOps teams: same language as much of their tooling, and direct control over chart layout and messaging.
41% in Organizations: Multi-Tool Reality
Only 41% of organizations use GitHub Actions as their primary CI/CD solution. JetBrains' State of CI/CD 2025 notes that 32% of organizations use two different CI/CD tools, and 9% use at least three—so multi-tool setups are common, driven by legacy (Jenkins, GitLab), enterprise requirements, and gradual migration. GitHub Actions often coexists with Jenkins, GitLab CI, or cloud-native pipelines; Python is used to orchestrate or analyze runs across tools. GitHub's Actions metrics documentation and Actions performance metrics GA provide visibility into usage—and Python scripts can pull that data and visualize it for dashboards and reports.
Python, Actions, and the CI/CD Stack
Python is deeply embedded in the GitHub Actions and CI/CD story. Many workflows run Python for testing (pytest), linting (ruff, black), building (setuptools, poetry), and deployment scripts; composite actions and reusable workflows often wrap Python logic. When teams visualize Actions adoption, job duration, or failure rates, they typically use Python and pandas, matplotlib, or seaborn—often pulling data from the GitHub API or Actions metrics. So the story is not just "GitHub Actions won"; it is Python as the language of CI/CD logic and analytics, from workflow steps to dashboards.
What the 62% and 71M Figures Mean for Developers and Teams
The 62% personal and 71 million jobs per day figures have practical implications. JetBrains' State of CI/CD surveyed developers globally; GitHub's blog reports official usage. For new projects, the takeaway is that GitHub Actions is the default choice for CI/CD when the repo is on GitHub—unless the org standardizes on Jenkins or GitLab. For hiring and training, GitHub Actions and YAML workflows are core skills for DevOps and platform roles. For reporting, Python remains the language of choice for pulling GitHub metrics or survey data and visualizing CI/CD adoption—so the same Python scripts that power internal dashboards can power articles and public reports.
Conclusion: GitHub Actions as the Default for Open Source and Many Teams
In 2026, GitHub Actions has become the default CI/CD for personal projects and open source: 62% use it for personal projects—the most popular CI/CD tool for individuals—and 41% use it in organizations. 11.5 billion minutes were used in public/OSS in 2025 (+35% YoY), and the platform powers 71 million jobs per day—more than triple early 2024. GitHub re-architected Actions to scale 10x and improve reliability. Python is central to this story: the language of workflow steps (tests, lint, build) and the language of visualization for adoption and usage. Teams that treat GitHub Actions as the default for CI/CD—and use Python to build and measure—are well positioned for 2026 and beyond: GitHub Actions is where CI/CD runs; Python is where the story gets told.


