

LinkedIn reached nearly 1.3 billion members and $18 billion in trailing-twelve-month revenue in 2026—holding 36.6% of the recruitment market and ranking as the world's #1 job board. According to LinkedIn's Q1 2025 business highlights and Business of Apps' LinkedIn statistics 2026, revenue grew 10% year-over-year (9% in constant currency); TechCrunch reports Premium subscriptions passed $2 billion in revenue over 12 months. Statista's LinkedIn revenue and Statista revenue by segment place fiscal 2025 revenue above $16 billion, with Talent Solutions ($7B), Advertising ($5B), Premium ($2B), and Sales Navigator ($1B). 6sense's LinkedIn market share reports 36.60% share in the recruitment category; engagement is up with 24% more comments and three consecutive quarters of double-digit growth in video uploads. Python is the tool many teams use to visualize professional-network and recruitment data for reports like this one. This article examines why LinkedIn crossed 1.3B members and $18B revenue, how Talent and B2B drive growth, and how Python powers the charts that tell the story.
1.3B Members, $18B Revenue: LinkedIn at Scale
LinkedIn's member and revenue growth did not happen overnight. LinkedIn Q1 2025 and Business of Apps report nearly 1.3 billion members and $18 billion in revenue over the past twelve months (10% year-over-year); Microsoft FY26 Q1 metrics and Statista document fiscal 2025 revenue above $16 billion. The following chart, generated with Python and matplotlib using industry-style data, illustrates LinkedIn annual revenue (billions USD) from 2020 to 2026.
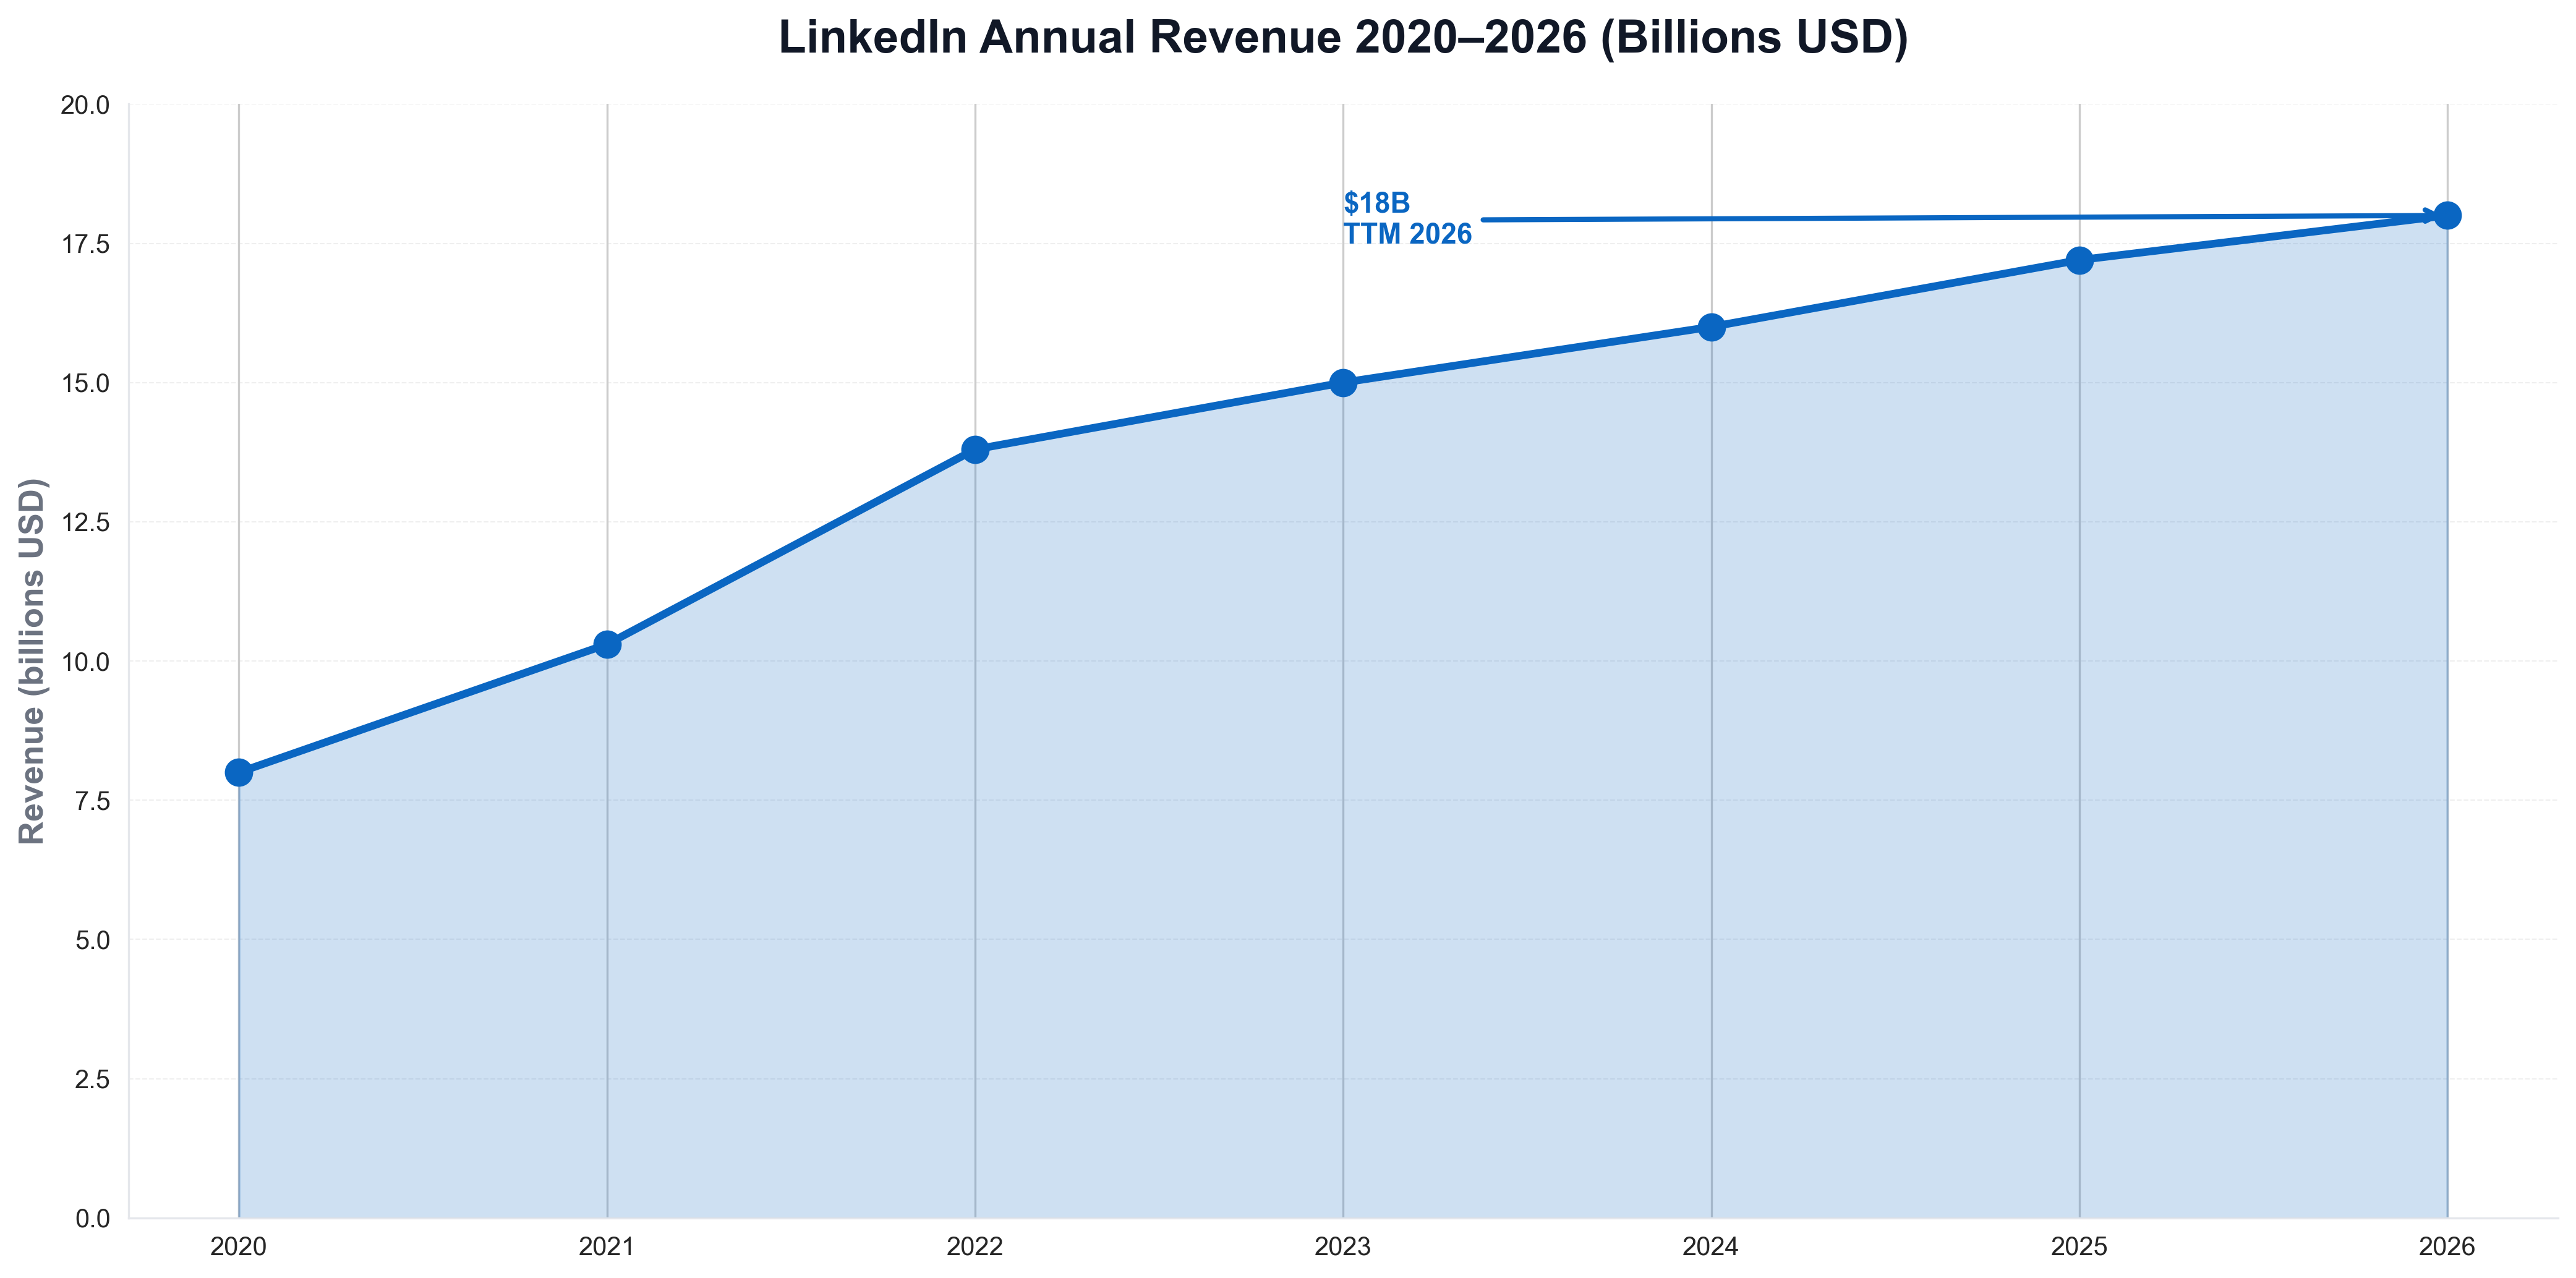
The chart above shows $18B in TTM revenue and continued growth—reflecting LinkedIn as the default for professional identity and B2B. Python is the natural choice for building such visualizations: talent and product teams routinely use Python scripts to load revenue or member data and produce publication-ready charts for reports and articles like this one.
37% Recruitment Share, #1 Job Board: Market Leadership
The scale of LinkedIn's lead in recruitment and professional networking is striking. 6sense reports 36.60% market share in the recruitment category and #1 most popular job board globally; WMTips Glassdoor vs LinkedIn and Gartner Peer Insights note LinkedIn is 404 times more popular than Glassdoor across websites and leads in the United States, United Kingdom, Germany, Netherlands, and France. Indeed and Glassdoor follow in different roles (job listings vs employer reviews). When teams need to visualize market share or competitor positioning, they often use Python and matplotlib or seaborn. The following chart, produced with Python, summarizes recruitment / job board market share (LinkedIn vs Indeed vs Glassdoor vs others) in a style consistent with industry reports.
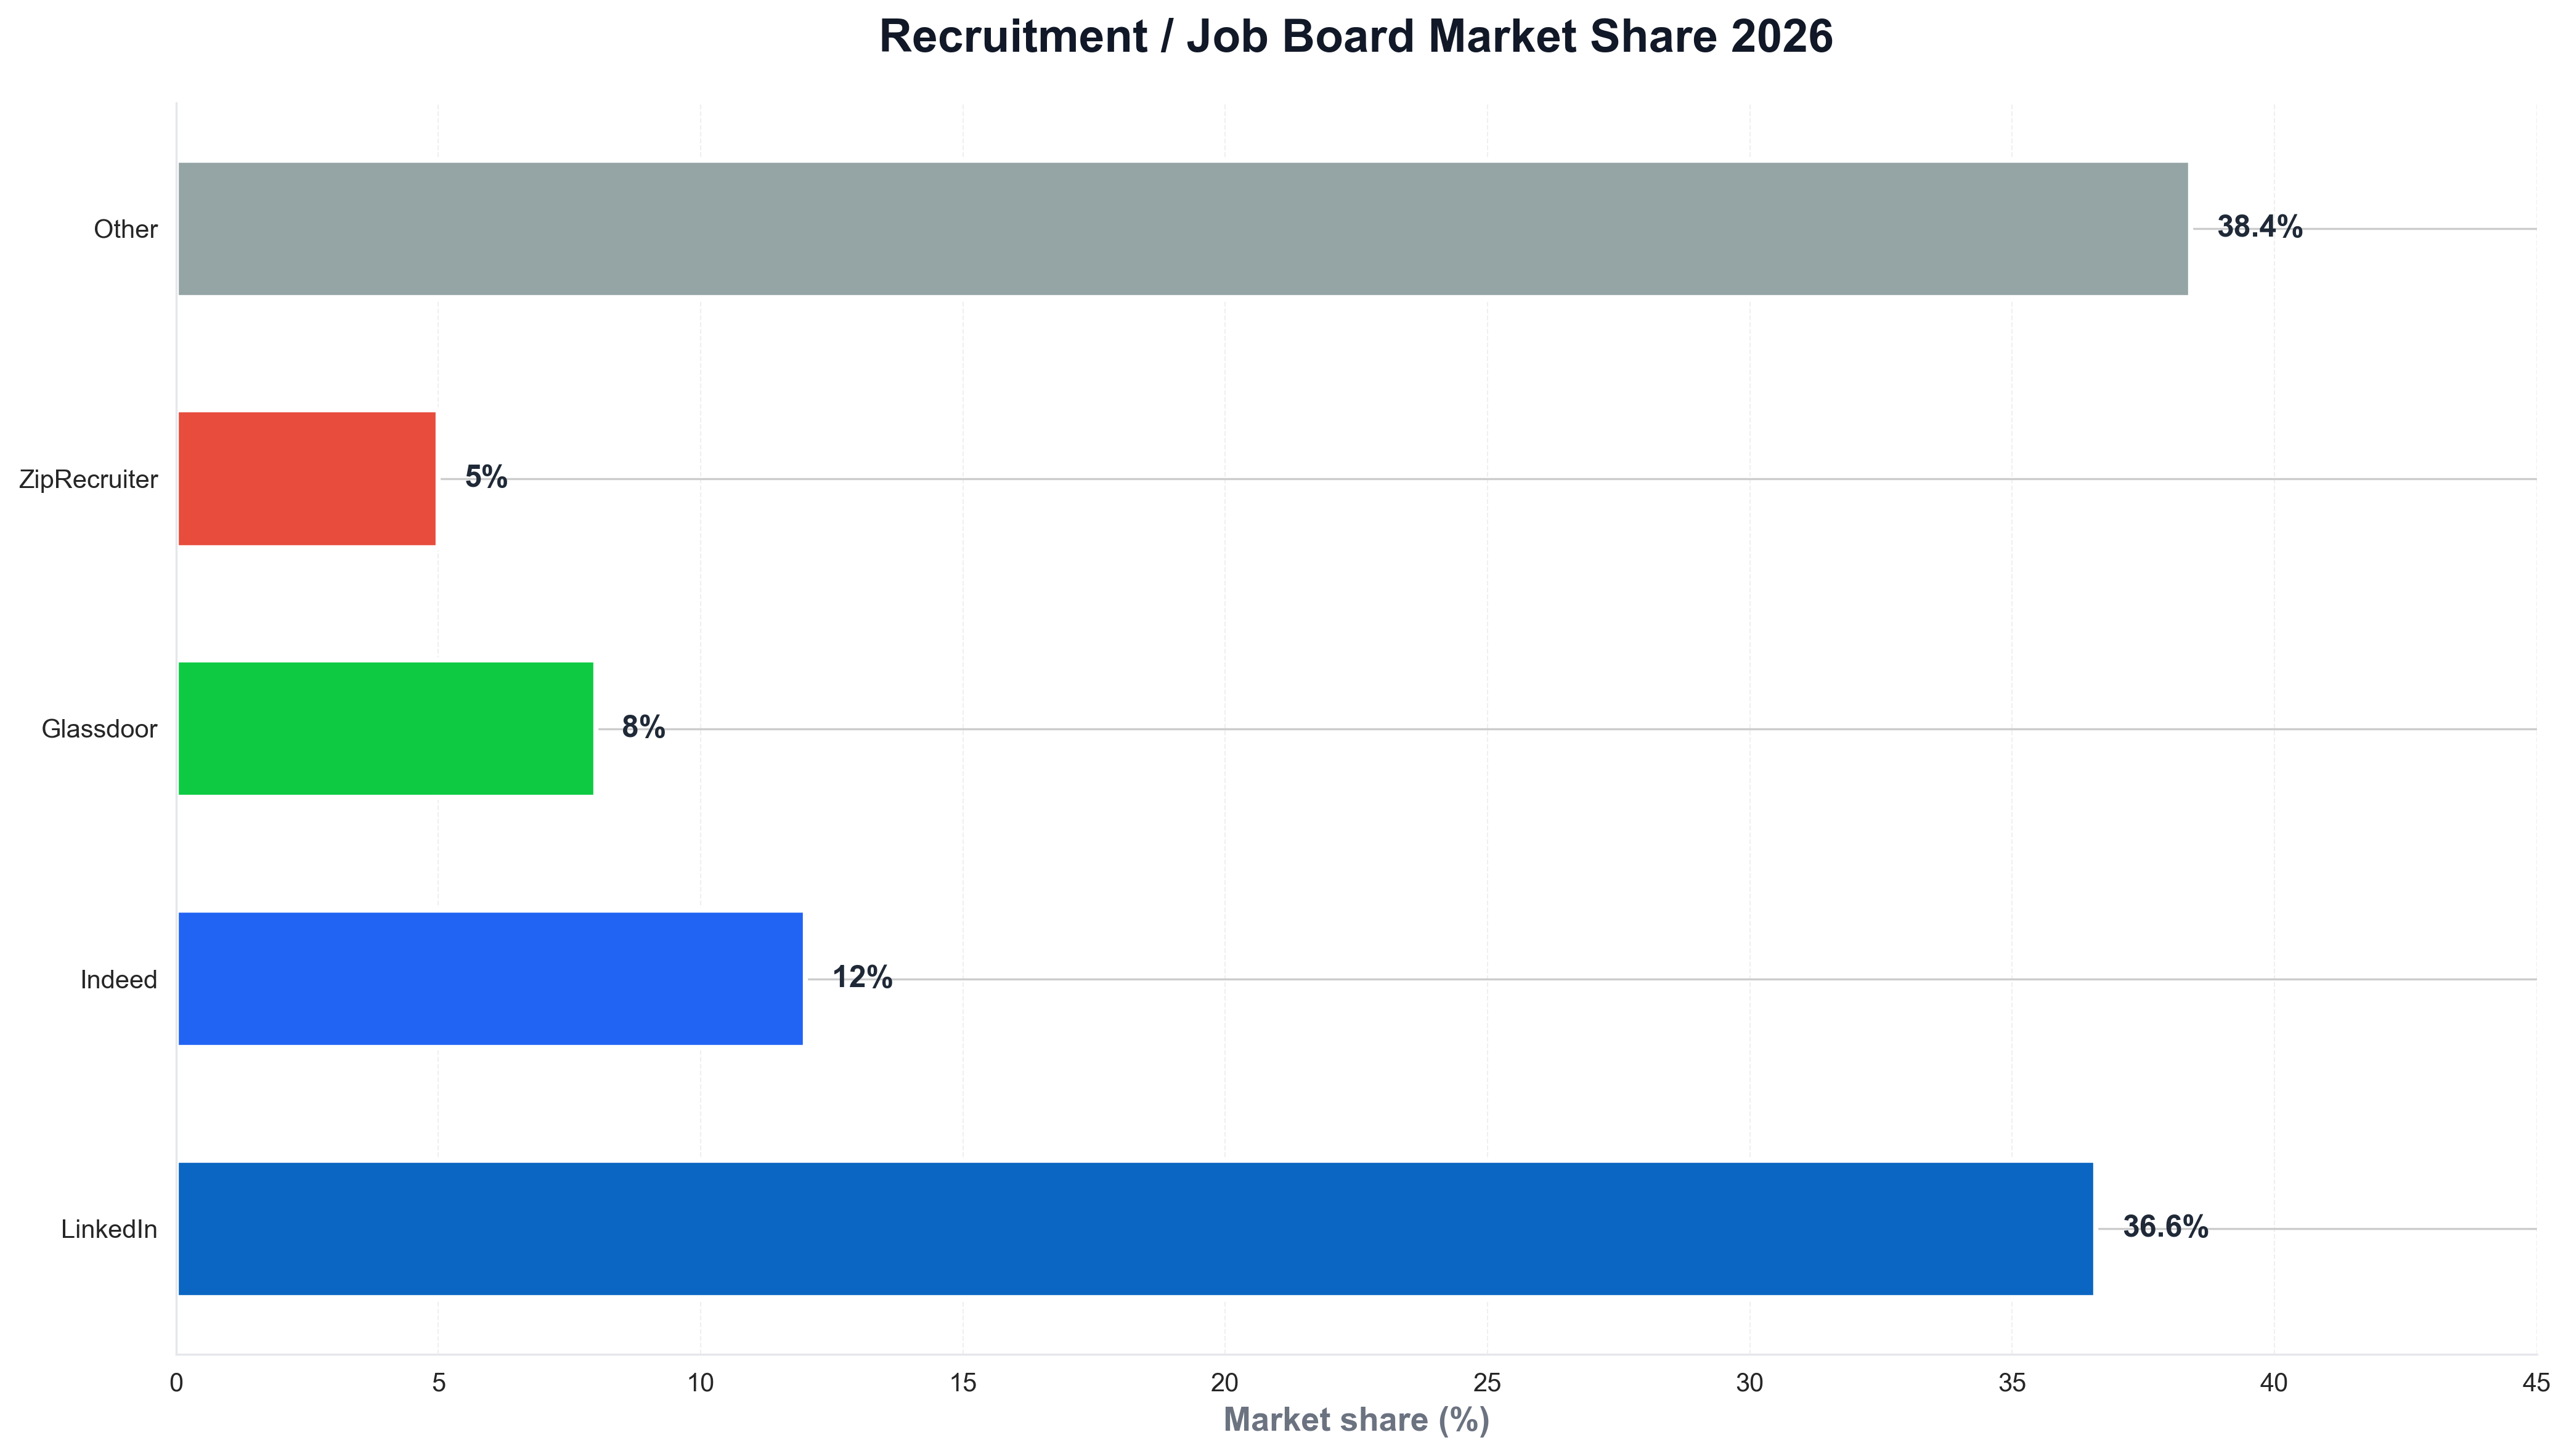
The chart illustrates LinkedIn well ahead of Indeed and Glassdoor—context that explains why recruiters and professionals choose LinkedIn for hiring, networking, and content. Python is again the tool of choice for generating such charts from market or survey data, keeping analytics consistent with the rest of the data stack.
$2B Premium, Talent $7B, Ads $5B: Why LinkedIn Wins B2B
Revenue mix and engagement are central to LinkedIn's 2026 story. TechCrunch and Statista revenue by segment report $2 billion in Premium revenue (12 months), ~$7 billion in Talent Solutions, ~$5 billion in Advertising, and ~$1 billion in Sales Navigator; LinkedIn Q1 2025 notes 24% more comments and three consecutive quarters of double-digit growth in video uploads. For teams that track revenue or members over time, Python is often used to load financial or engagement data and plot trends. A minimal example might look like the following: load a CSV of LinkedIn revenue by year, and save a chart for internal or public reporting.
import pandas as pd
import matplotlib.pyplot as plt

df = pd.read_csv("linkedin_revenue_by_year.csv")
fig, ax = plt.subplots(figsize=(10, 5))
ax.plot(df["year"], df["revenue_billions"], marker="o", linewidth=2, color="#0a66c2")
ax.set_ylabel("Revenue (billions USD)")
ax.set_title("LinkedIn annual revenue (industry style)")
fig.savefig("public/images/blog/linkedin-revenue-trend.png", dpi=150, bbox_inches="tight")
plt.close()
That kind of Python script is typical for talent and finance teams: same language used for pipelines and dashboards, and direct control over chart layout and messaging.
Microsoft, Engagement, and the Road Ahead
Ownership and product evolution shape LinkedIn's 2026 story. Microsoft acquired LinkedIn in 2016; LinkedIn is now core to Microsoft 365, Dynamics, and Advertising. Business of Apps and LinkedIn news document engagement gains (comments, video) and AI features (profile suggestions, job matching). Python is the language many use to analyze professional-network and recruitment data and visualize revenue and market share for reports like this one.
Conclusion: LinkedIn as the Professional Network Default in 2026
In 2026, LinkedIn is the default for professional networking and recruitment: 1.3 billion members, $18 billion TTM revenue, 36.6% recruitment market share, #1 job board globally, and $2 billion in Premium revenue. Talent, Ads, and Sales Navigator drive the mix; Indeed and Glassdoor serve adjacent roles. Python remains the language that powers the analytics—revenue, market share, and the visualizations that explain the story—so that for Google News and Google Discover, the story in 2026 is clear: LinkedIn is where the world works, and Python is how many of us chart it.


