

Nginx is the leading web server in 2026. According to W3Techs' web server usage statistics and W3Techs' Nginx market report, Nginx holds 33.3% market share among all websites whose web server is known—ahead of Cloudflare Server (25.8%) and Apache (24.4%). The Netcraft November 2025 Web Server Survey reports Nginx at 25.21% and Apache at 12.61%; in that month Nginx gained 6.4 million sites (+1.89%) while Apache lost 3.6 million sites (-2.05%)—Apache's largest loss in the survey. SimilarTech's Nginx vs Apache comparison shows Nginx leading with 7.27 million websites versus Apache's 6.30 million, and Nginx dominates high-traffic segments (top 10K, 100K, 1M sites). Python is the tool many teams use to visualize web server adoption and survey data for reports like this one. This article examines why Nginx leads in 2026, how Apache and Cloudflare compare, and how Python powers the charts that tell the story.
33.3% Market Share: Nginx Leads W3Techs and Netcraft
Nginx's market leadership did not happen overnight. W3Techs and W3Techs' Nginx vs Apache comparison report Nginx at 33.3% and Apache at 24.4% in January 2026; Cloudflare Server sits at 25.8%, so the top three are Nginx, Cloudflare, and Apache. Netcraft's November 2025 survey shows Nginx at 25.21% (gaining 0.26 percentage points) and Apache at 12.61% (losing 0.37 percentage points). The following chart, generated with Python and matplotlib using W3Techs and Netcraft–style data, illustrates web server market share (Nginx, Cloudflare, Apache, others) in 2025–2026.
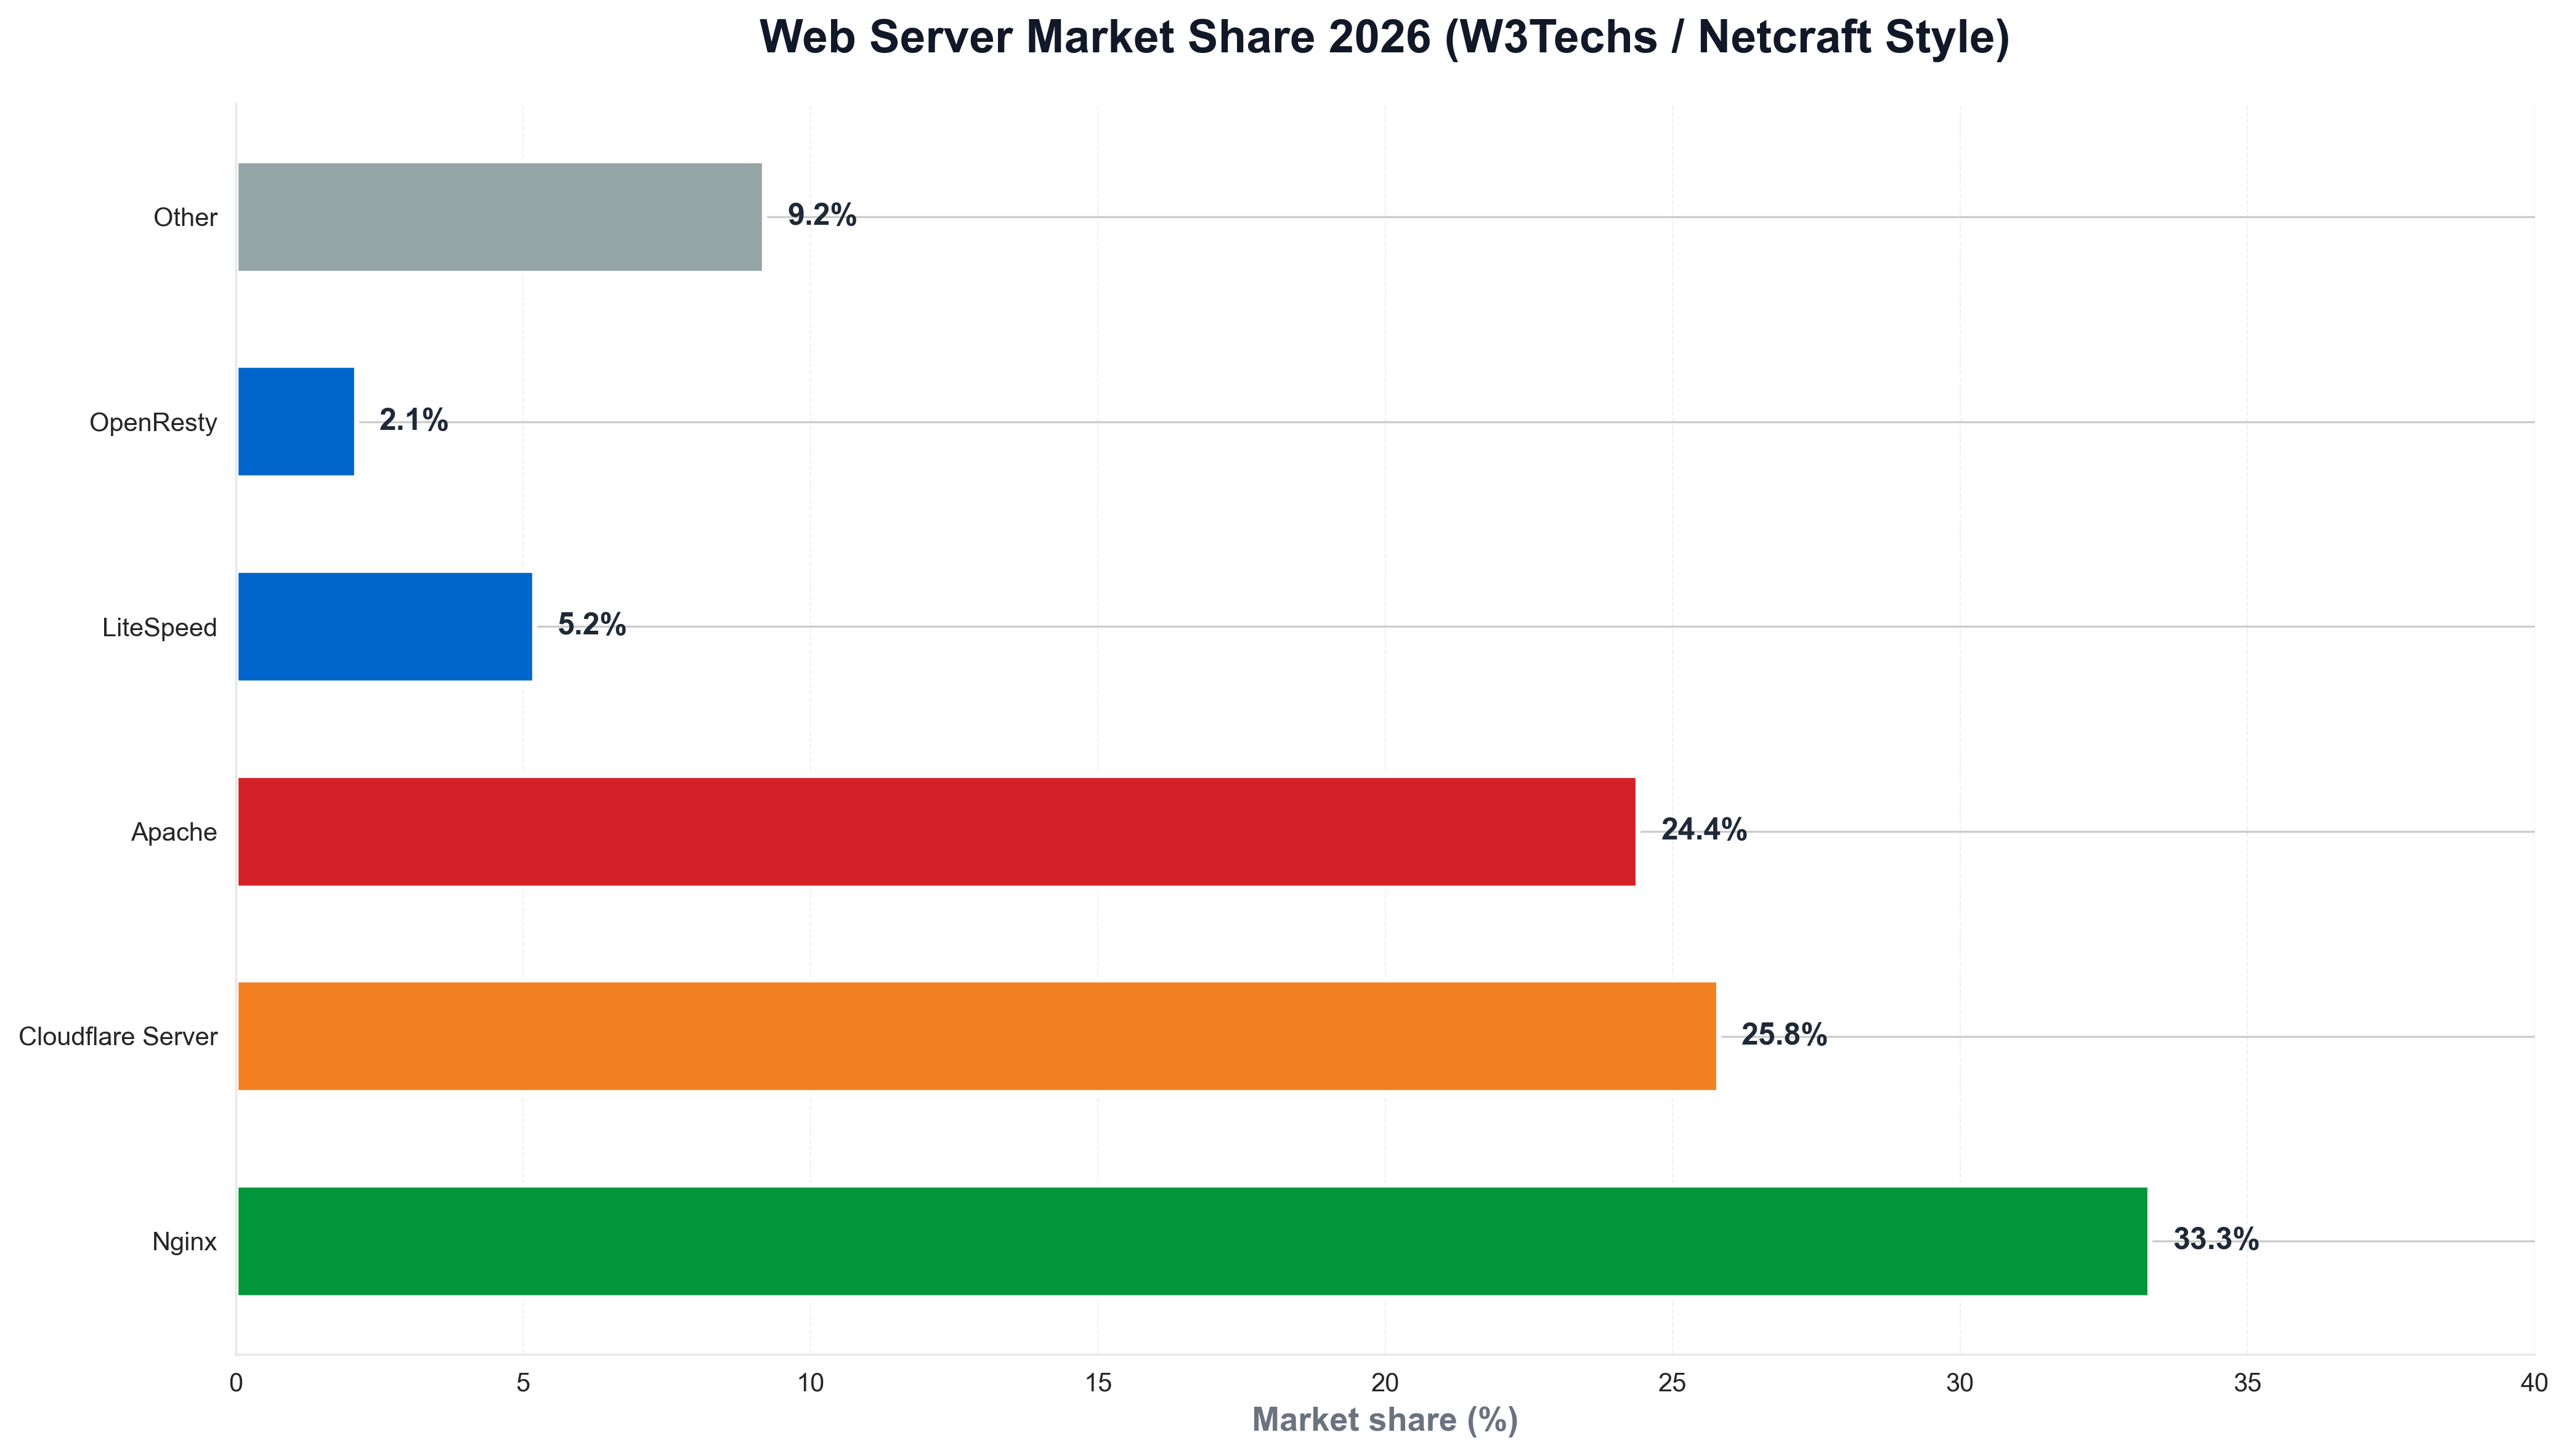
The chart above shows Nginx leading, Cloudflare and Apache close behind—reflecting the shift toward high-performance and edge serving. Python is the natural choice for building such visualizations: infrastructure and DevOps teams routinely use Python scripts to load survey or telemetry data and produce publication-ready charts for reports and articles like this one.
+6.4 Million Sites in One Month: Nginx Gain, Apache's Largest Loss
The scale of Nginx's growth and Apache's decline in late 2025 is striking. Netcraft November 2025 reports Nginx gaining 6.4 million sites in a single month (+1.89%) and Apache losing 3.6 million sites (-2.05%)—Apache's largest loss in the survey. That momentum reflects cloud-native and reverse-proxy adoption: Nginx is widely used as a load balancer, reverse proxy, and API gateway in front of application servers, and W3Techs' usage by ranking shows Nginx at 32.0% among the top 1,000 websites and 31.8% among the top 10,000—so high-traffic sites favor Nginx. When teams need to visualize web server share over time—by month, segment, or region—they often use Python and matplotlib or seaborn. The following chart, produced with Python, summarizes Nginx vs Apache share trend in a style consistent with Netcraft and W3Techs.
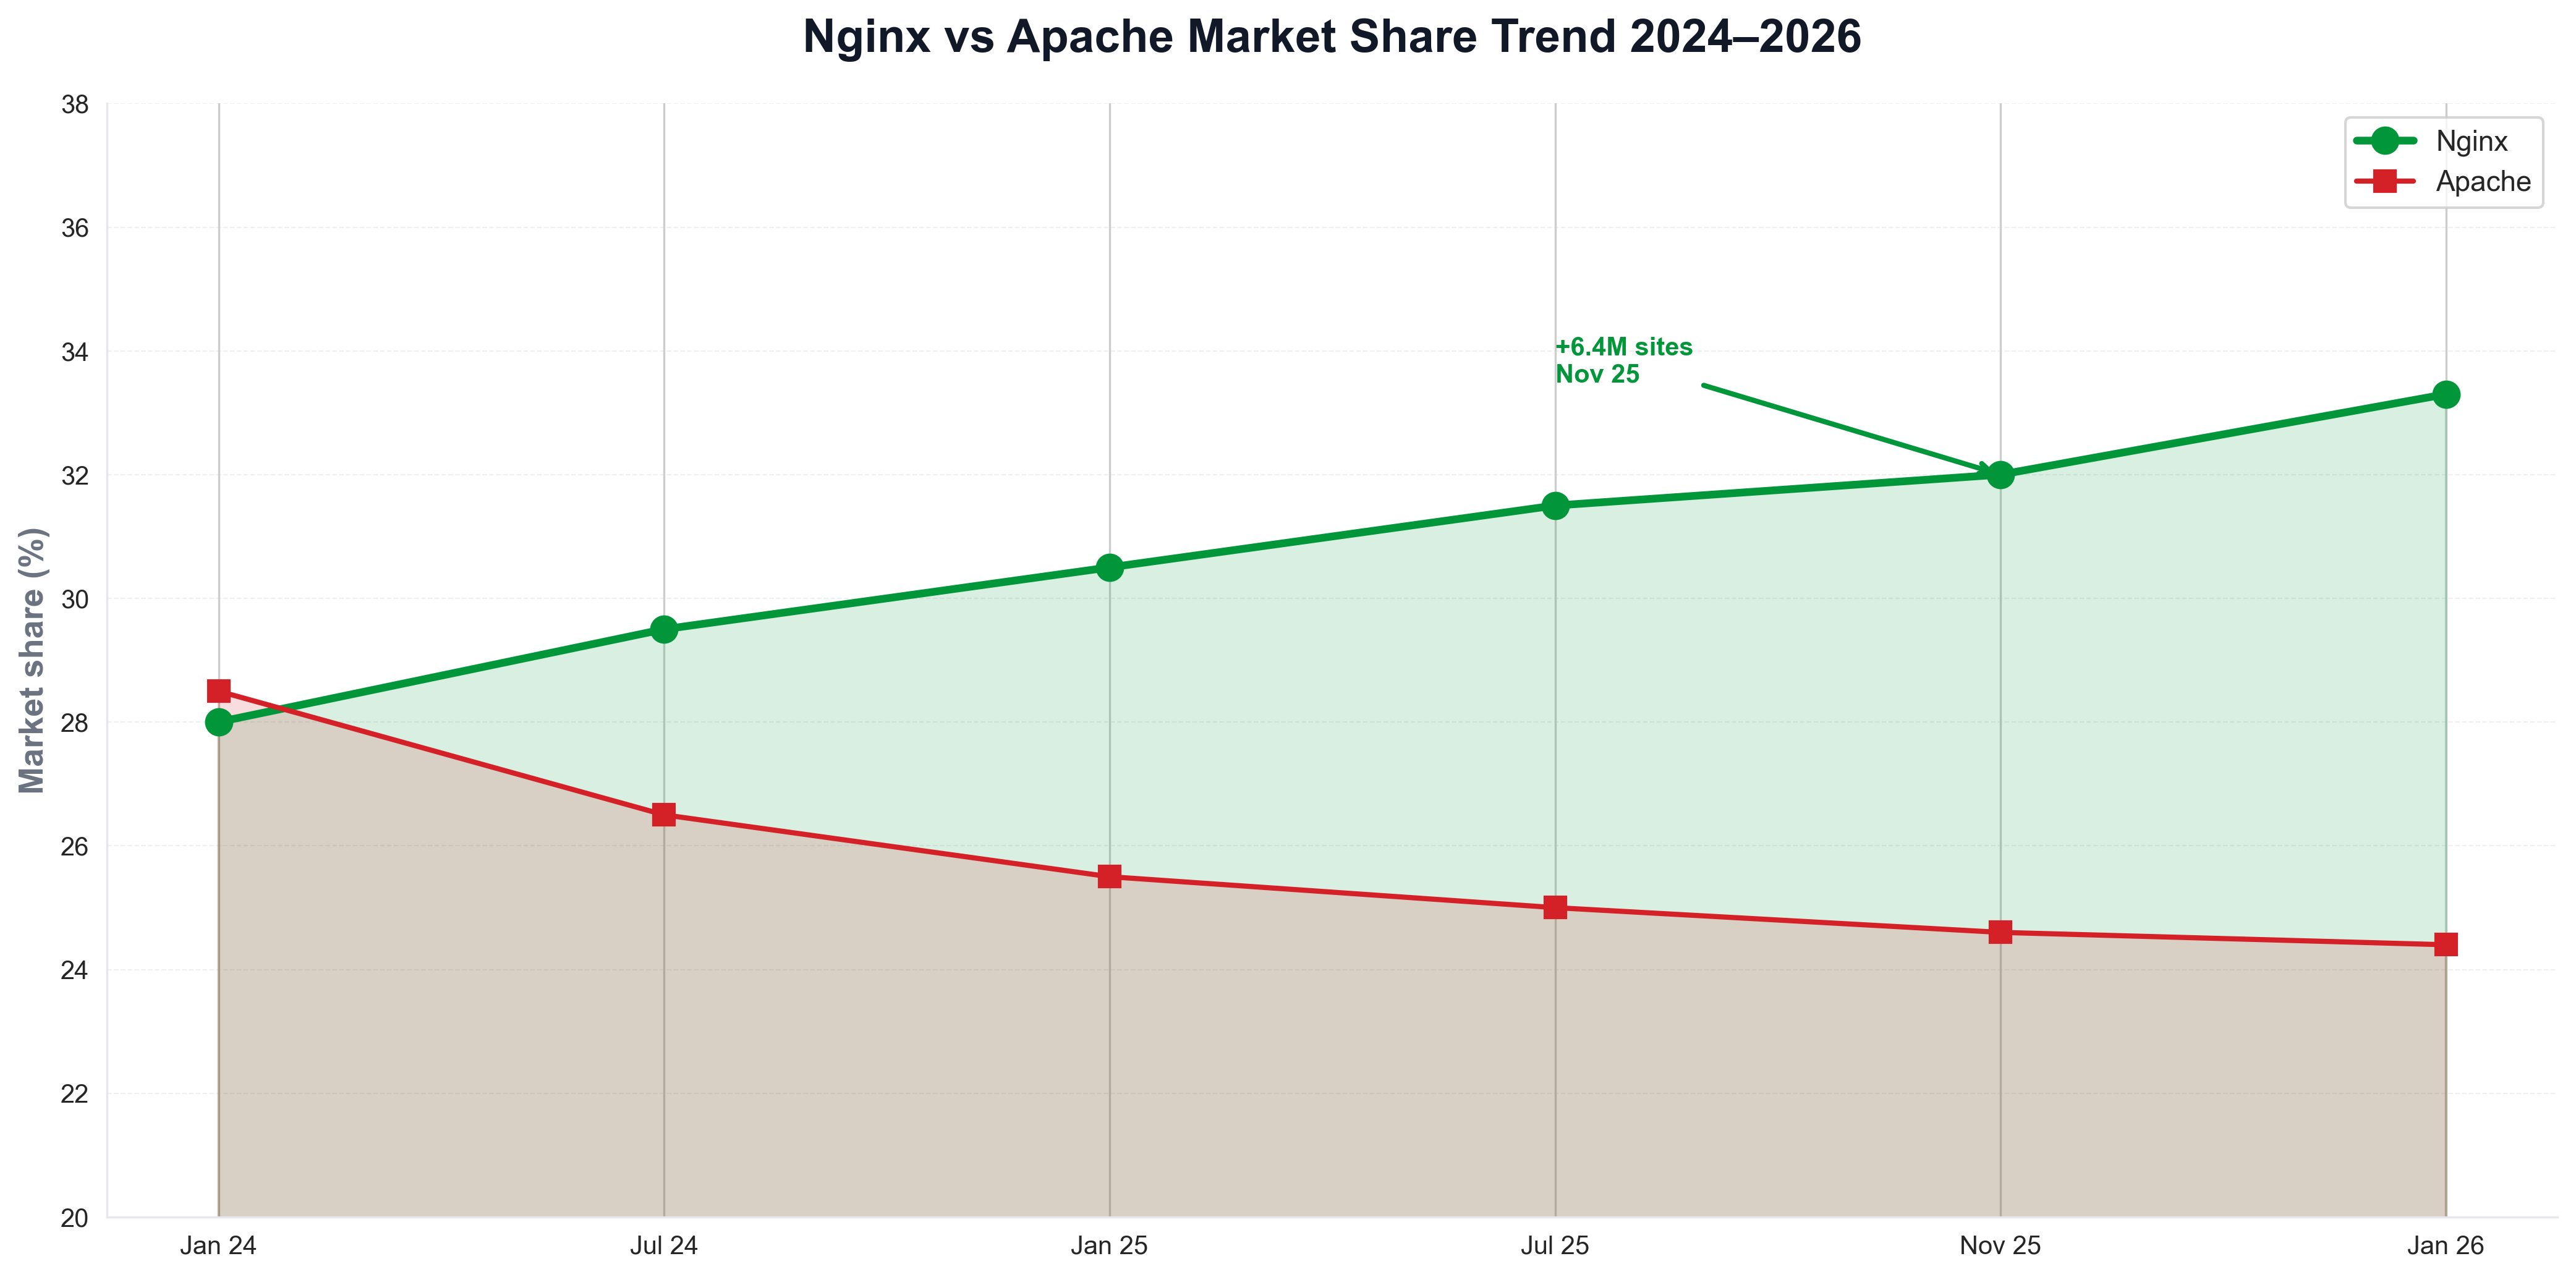
The chart illustrates Nginx rising and Apache declining—context that explains why Nginx is the default for many new deployments. Python is again the tool of choice for generating such charts from survey or telemetry data, keeping analytics consistent with the rest of the data stack.
High-Traffic Dominance: Top 1K, 10K, 100K Sites
Nginx's strength in high-traffic segments is well documented. W3Techs' usage by ranking reports Nginx at 32.0% among the top 1,000 websites, 31.8% among the top 10,000, 28.8% among the top 100,000, and 29.5% among the top 1,000,000—so Nginx is overrepresented in the most heavily trafficked sites. SimilarTech notes that Nginx leads in the top 10K, 100K, and 1M segments globally, while Apache maintains a stronger presence in some geographic regions (e.g., Germany, France, UK, Italy). For teams that track web server adoption or traffic share over time, Python is often used to load W3Techs-style or Netcraft data and plot trends. A minimal example might look like the following: load a CSV of web server share by month, and save a chart for internal or public reporting.
import pandas as pd
import matplotlib.pyplot as plt

df = pd.read_csv("web_server_share_by_month.csv")
fig, ax = plt.subplots(figsize=(10, 5))
ax.plot(df["month"], df["nginx_pct"], marker="o", linewidth=2, color="#009639", label="Nginx")
ax.plot(df["month"], df["apache_pct"], marker="s", linewidth=2, color="#d42027", label="Apache")
ax.set_ylabel("Market share (%)")
ax.set_title("Nginx vs Apache market share (Netcraft/W3Techs style)")
ax.legend()
fig.savefig("public/images/blog/nginx-apache-trend.png", dpi=150, bbox_inches="tight")
plt.close()
That kind of Python script is typical for infrastructure and platform teams: same language used for automation and dashboards, and direct control over chart layout and messaging.
Cloudflare, Apache, and the Three-Way Race
Nginx does not exist in isolation. W3Techs reports Cloudflare Server at 25.8%—often reflecting sites that sit behind Cloudflare's proxy and report Cloudflare as the server—so the visible web server landscape is Nginx (33.3%), Cloudflare (25.8%), and Apache (24.4%). Apache remains the default on many shared hosting and legacy environments; Nginx is the default for reverse proxy, load balancing, and high-concurrency serving. Netcraft's December 2024 survey noted Nginx at 19.67% and Apache at 17.30%—so the gap has widened over the past year. Python is the language many use to analyze W3Techs or Netcraft data and visualize web server adoption for reports like this one.
Conclusion: Nginx as the Web Server Leader in 2026
In 2026, Nginx leads the web server market: 33.3% share (W3Techs), 25.21% in Netcraft (November 2025), and +6.4 million sites in a single month—while Apache lost 3.6 million (its largest loss). Cloudflare Server holds 25.8% and Apache 24.4%; Nginx dominates high-traffic segments (top 1K, 10K, 100K). Python remains the language that powers the analytics—W3Techs, Netcraft, and the visualizations that explain the story—so that for Google News and Google Discover, the story in 2026 is clear: Nginx is where the web serves, and Python is how many of us chart it.


