

Stripe processed $1.4 trillion in payment volume in 2024—38% year-over-year growth—and handles over 500 million API requests daily. According to SQ Magazine's Stripe statistics 2025 and CoinLaw's Stripe usage and revenue, Stripe's volume represents approximately 1.3% of global GDP; Red Stag Fulfillment's Stripe adoption and Stripe market share report 1.35 million live websites using Stripe globally, 4.9 million total having integrated it, and ~22,000 new users joining daily. Over 50% of Fortune 100 and 62% of Fortune 500 companies use Stripe; the platform holds 20.8% of the global payment processing market (second to PayPal) and ~45% in the United States, with a $91.5 billion valuation in early 2025. Medium's Stripe API scale and CNBC note Stripe passed $1 trillion in volume in 2023 and achieved 99.999% uptime at scale. Python is the tool many teams use to visualize payment and adoption data for reports like this one. This article examines why Stripe crossed $1.4T, how the API became the default for developers, and how Python powers the charts that tell the story.
$1.4 Trillion Processed: 38% Growth and 1.3% of Global GDP
Stripe's payment volume did not cross a trillion overnight. CNBC and Bloomberg report Stripe passed $1 trillion in total payment volume in 2023; SQ Magazine and CoinLaw report $1.4 trillion in 2024—38% year-over-year growth—representing approximately 1.3% of global GDP. The following chart, generated with Python and matplotlib using industry-style data, illustrates Stripe payment volume (trillions USD) from 2021 to 2026.
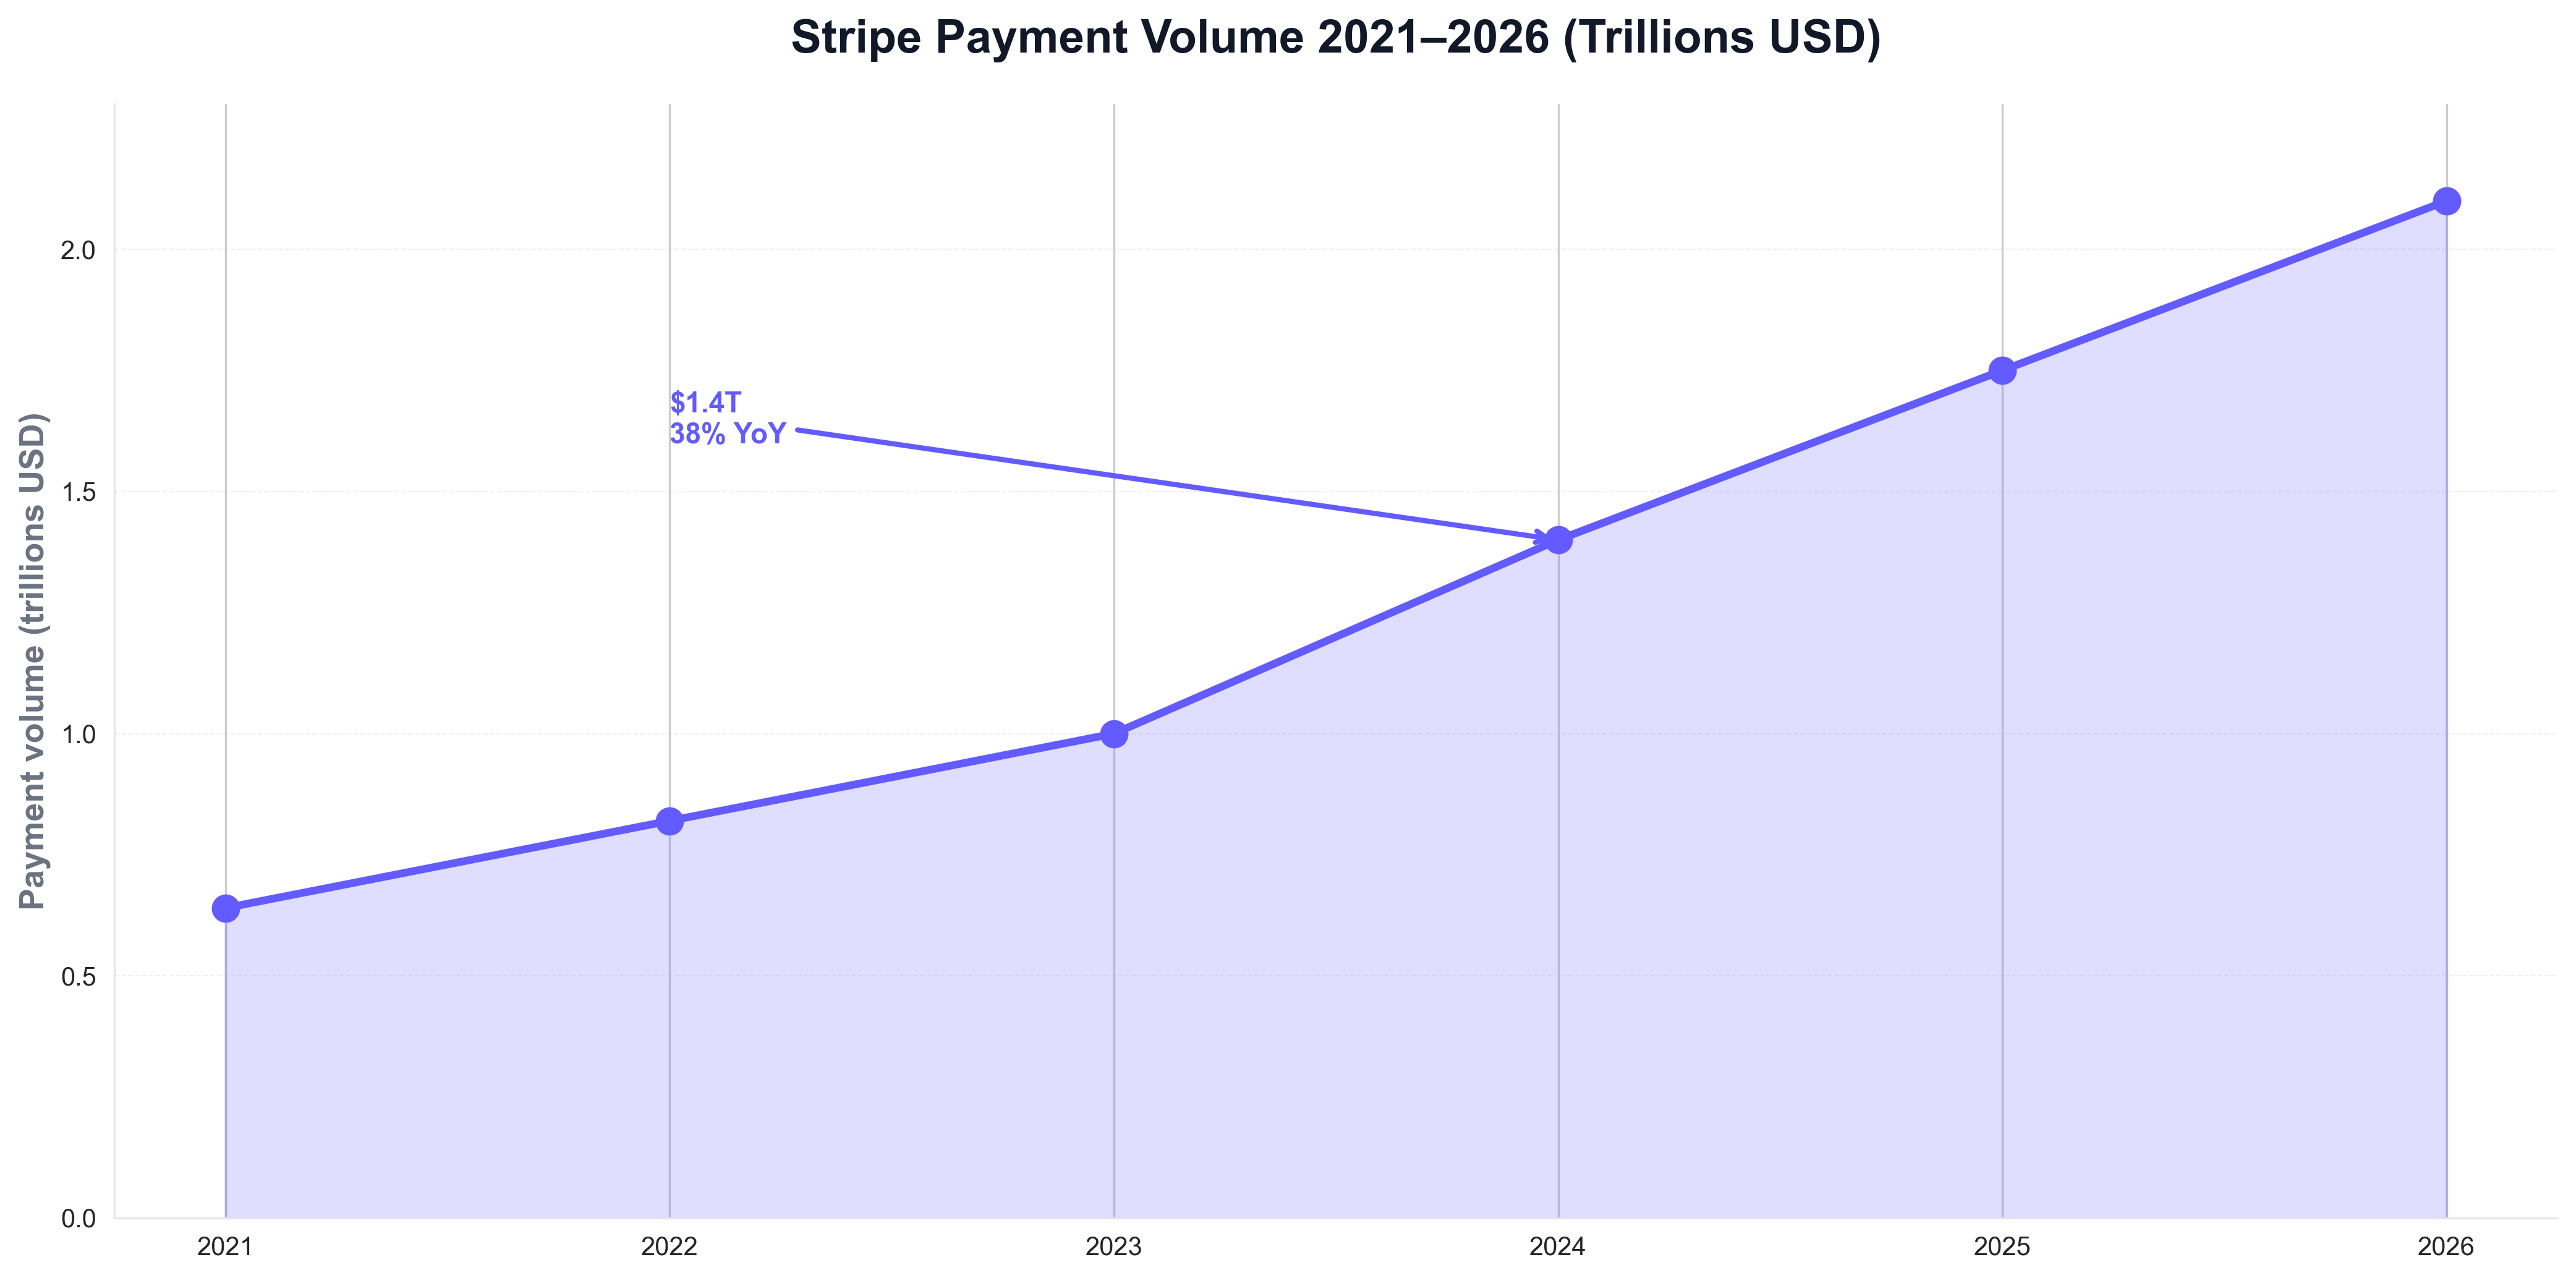
The chart above shows $1T in 2023 and $1.4T in 2024—reflecting Stripe as the default payment API for millions of businesses. Python is the natural choice for building such visualizations: fintech and data teams routinely use Python scripts to load volume or market data and produce publication-ready charts for reports and articles like this one.
1.35M Live Sites, 50% Fortune 100: Adoption at Scale
The scale of adoption is striking. Red Stag Fulfillment and SQ Magazine report 1.35 million live websites using Stripe globally and 4.9 million total having integrated it; ~22,000 new users join daily. Over 50% of Fortune 100 and 62% of Fortune 500 companies use Stripe; CoinLaw and Capital One Shopping Stripe statistics add 20.8% global market share (second to PayPal's 43.4%) and ~45% in the United States. When teams need to visualize market share or enterprise adoption, they often use Python and matplotlib or seaborn. The following chart, produced with Python, summarizes payment processing market share (Stripe vs PayPal vs others) in a style consistent with industry reports.
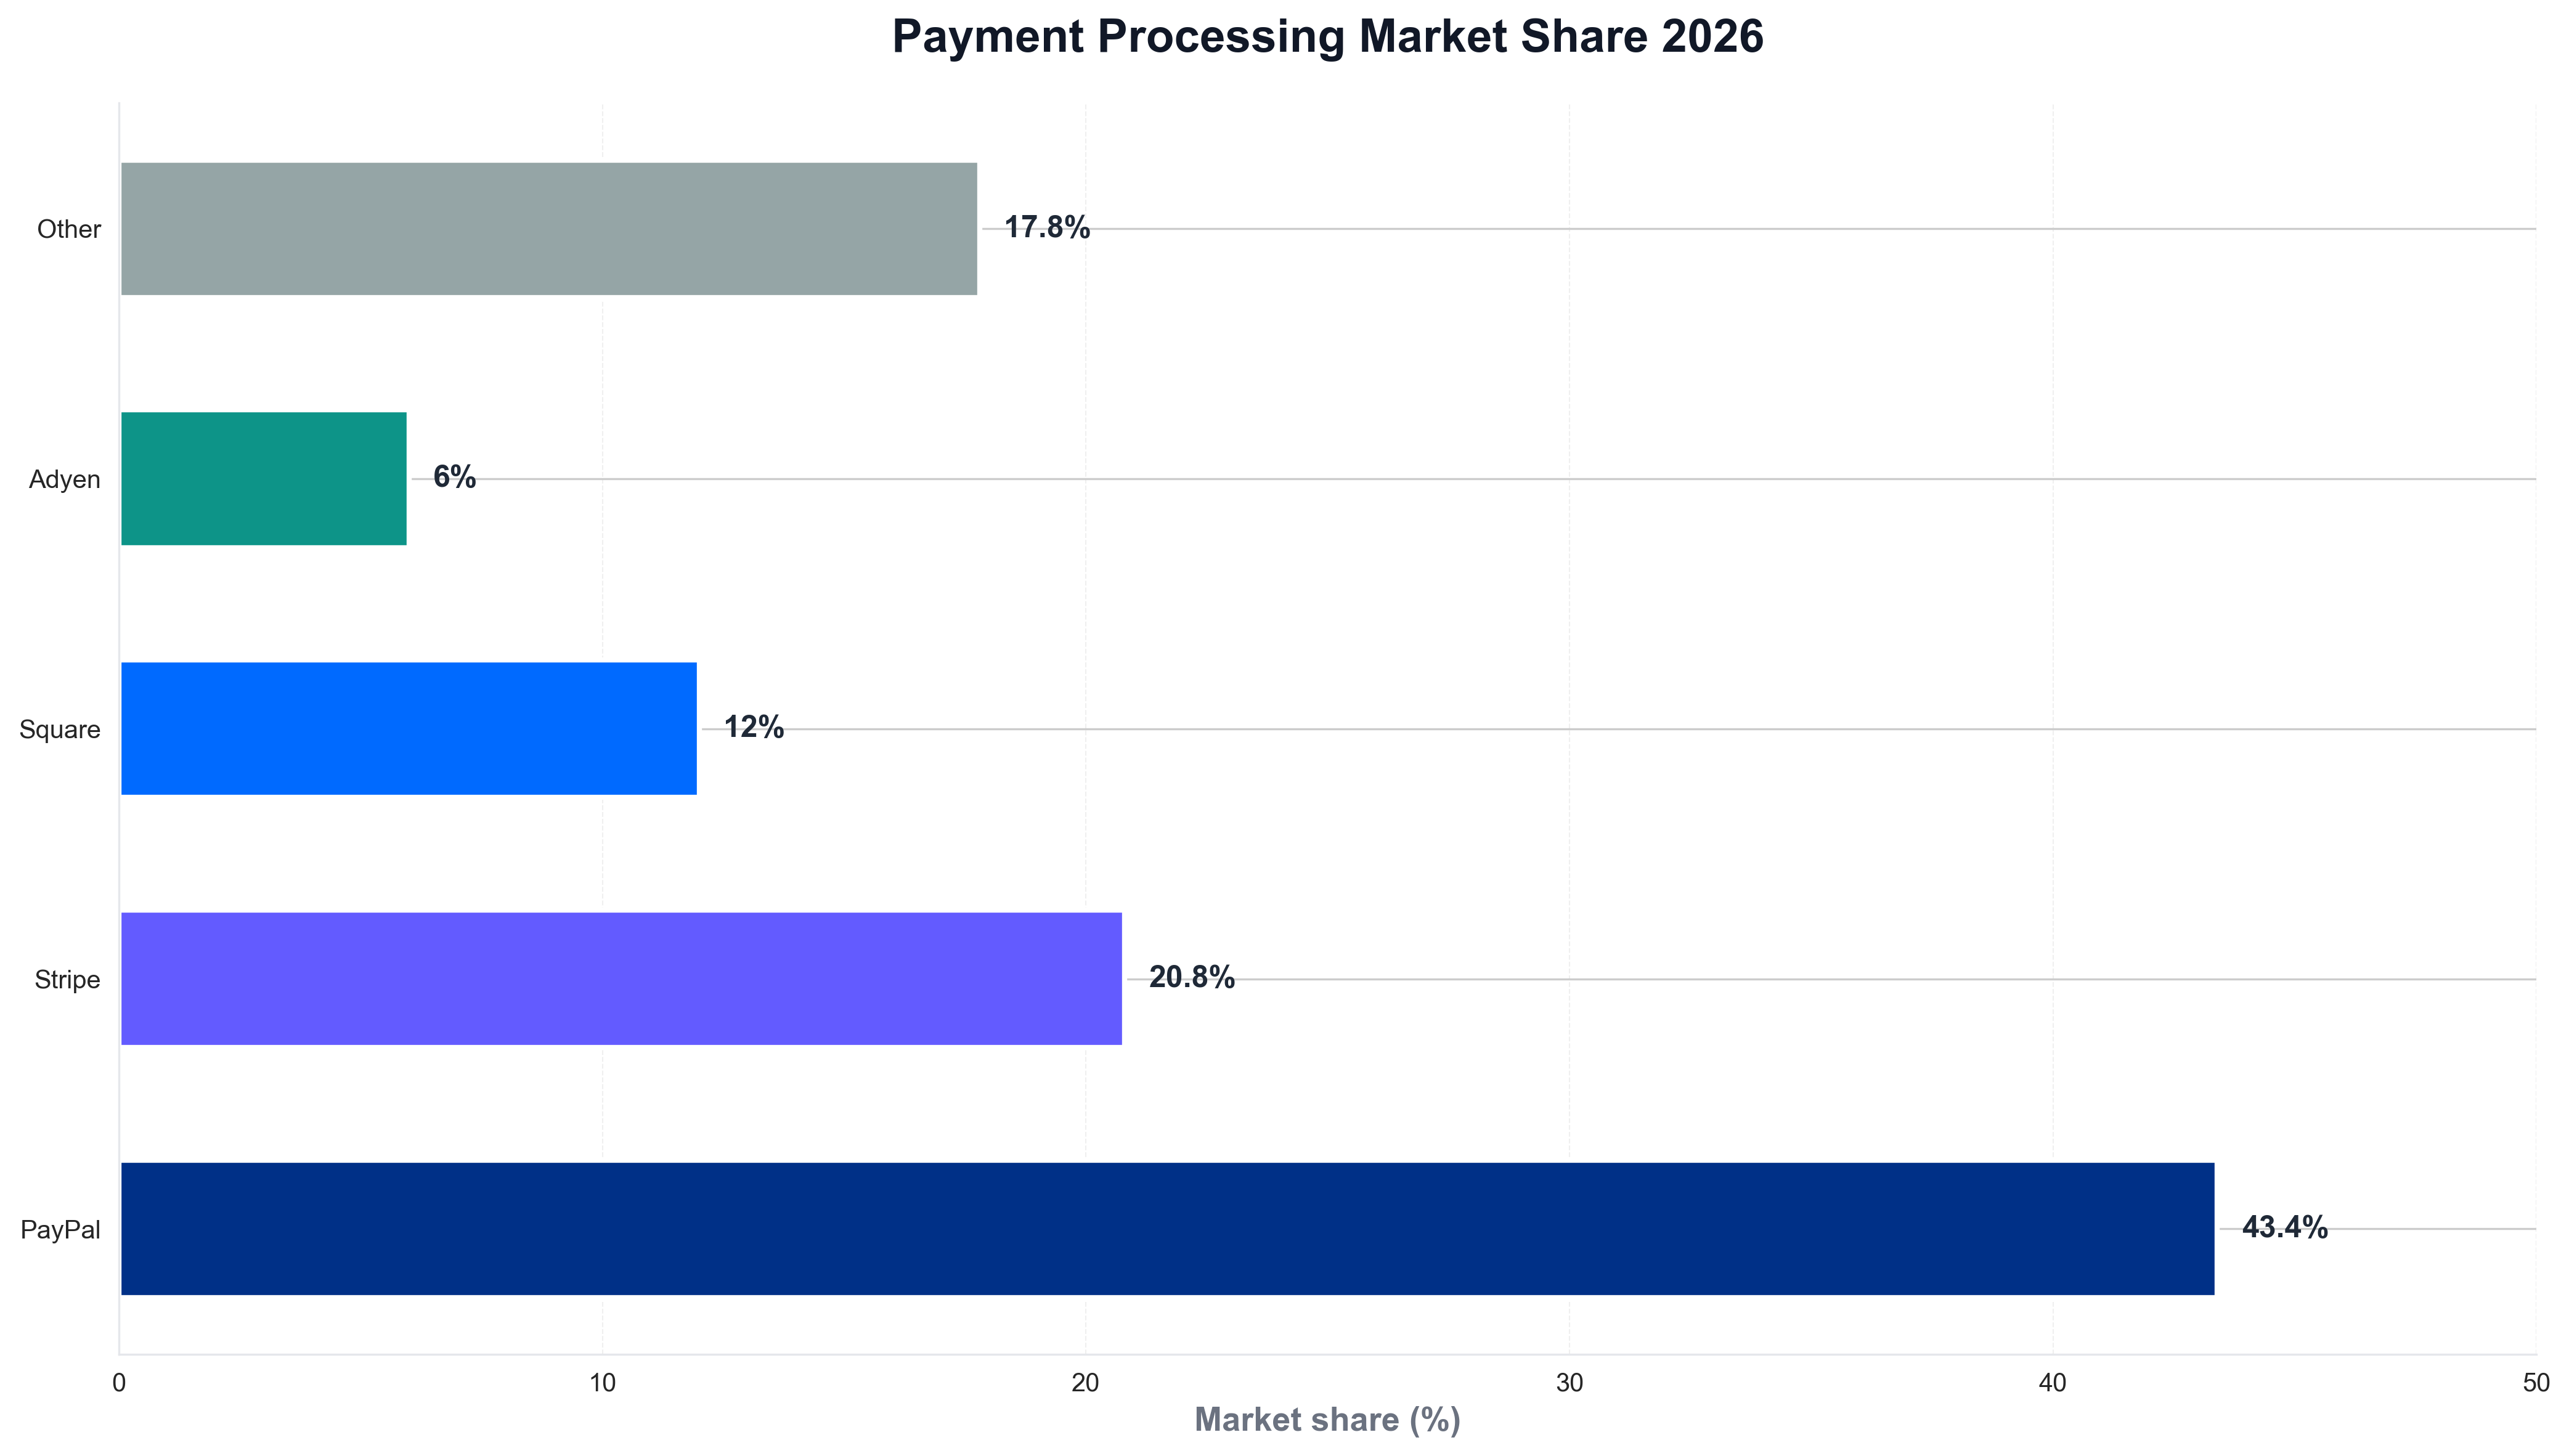
The chart illustrates Stripe as the second-largest player globally—context that explains why developers and enterprises choose Stripe as their default payment API. Python is again the tool of choice for generating such charts from market or internal data, keeping analytics consistent with the rest of the data stack.
500M+ API Requests Daily: Why the API Won
Developer experience and API reliability are central to Stripe's growth. Medium's Stripe API scale and industry reports note over 500 million API requests daily and 99.999% uptime at scale—Stripe's infrastructure (rate limiting, request handling) supports billions of API calls without catastrophic failures. Stripe's API pricing and Stripe newsroom document the platform's reach; Stripe supports 50+ countries, 195+ buyer markets, and 135+ currencies. For teams that track payment volume or API usage over time, Python is often used to load volume or usage data and plot trends. A minimal example might look like the following: load a CSV of payment volume by year, and save a chart for internal or public reporting.
import pandas as pd
import matplotlib.pyplot as plt

df = pd.read_csv("stripe_volume_by_year.csv")
fig, ax = plt.subplots(figsize=(10, 5))
ax.plot(df["year"], df["volume_trillions"], marker="o", linewidth=2, color="#635bff")
ax.set_ylabel("Payment volume (trillions USD)")
ax.set_title("Stripe payment volume (industry style)")
fig.savefig("public/images/blog/stripe-volume-trend.png", dpi=150, bbox_inches="tight")
plt.close()
That kind of Python script is typical for fintech and platform teams: same language used for pipelines and dashboards, and direct control over chart layout and messaging.
$91.5B Valuation, Profitability, and the Road Ahead
Valuation and profitability underscore Stripe's position. SQ Magazine and CoinLaw report a $91.5 billion valuation in early 2025 (tender offer) and profitability in 2024 after years of R&D investment; estimated net revenue of ~$5.1 billion in 2024. Stripe's expansion into South Asia, Latin America, and Eastern Europe in 2025 extends the platform's reach. Python is the language many use to analyze payment and adoption data and visualize volume and market share for reports like this one.
Conclusion: Stripe as the Trillion-Dollar Payment API in 2026
In 2026, Stripe is the default payment API for millions of businesses: $1.4 trillion processed in 2024 (38% YoY), 1.35 million live websites, 500M+ API requests daily, 50%+ Fortune 100 and 62% Fortune 500, 20.8% global market share, and $91.5B valuation. Python remains the language that powers the analytics—payment volume, market share, and the visualizations that explain the story—so that for Google News and Google Discover, the story in 2026 is clear: Stripe is where the world pays, and Python is how many of us chart it.


