

Figma leads the design tools market in 2026 with 40.65% market share and 13 million monthly active users. According to SQ Magazine's Figma statistics 2026 and Cropink's Figma statistics, Figma is well ahead of Adobe XD (13.5%) and InVision (7.6%); 6sense's Figma market share reports 36.98% in collaborative design and prototyping with 56,304 customers. Figma's 2025 AI report and Ramp's Figma data note 93% adoption among organizations in the software design category as of December 2025, and nearly 95% of Fortune 500 companies use Figma. Revenue reached $749 million in 2024 (48% growth) and Q1 2025 was $228 million (46% year-over-year); Reuters and TechCrunch report Figma's July 2025 IPO—shares surged 158% on debut and market cap hit ~$45 billion. Python is the tool many teams use to visualize design-tool adoption and revenue data for reports like this one. This article examines why Figma leads in 2026, how the IPO changed the category, and how Python powers the charts that tell the story.
41% Market Share: Figma Ahead of Adobe XD and InVision
Figma's market leadership did not happen overnight. SQ Magazine and Cropink report 40.65% market share—Adobe XD at 13.5% and InVision at 7.6%—so Figma holds a clear lead in the design tools category. 6sense reports 36.98% in collaborative design and prototyping with 56,304 current customers; the Information Technology sector leads with 12,800+ companies and Computer Software with 10,097. The following chart, generated with Python and matplotlib using industry-style data, illustrates design tools market share (Figma vs Adobe XD vs InVision vs others) in 2025–2026.
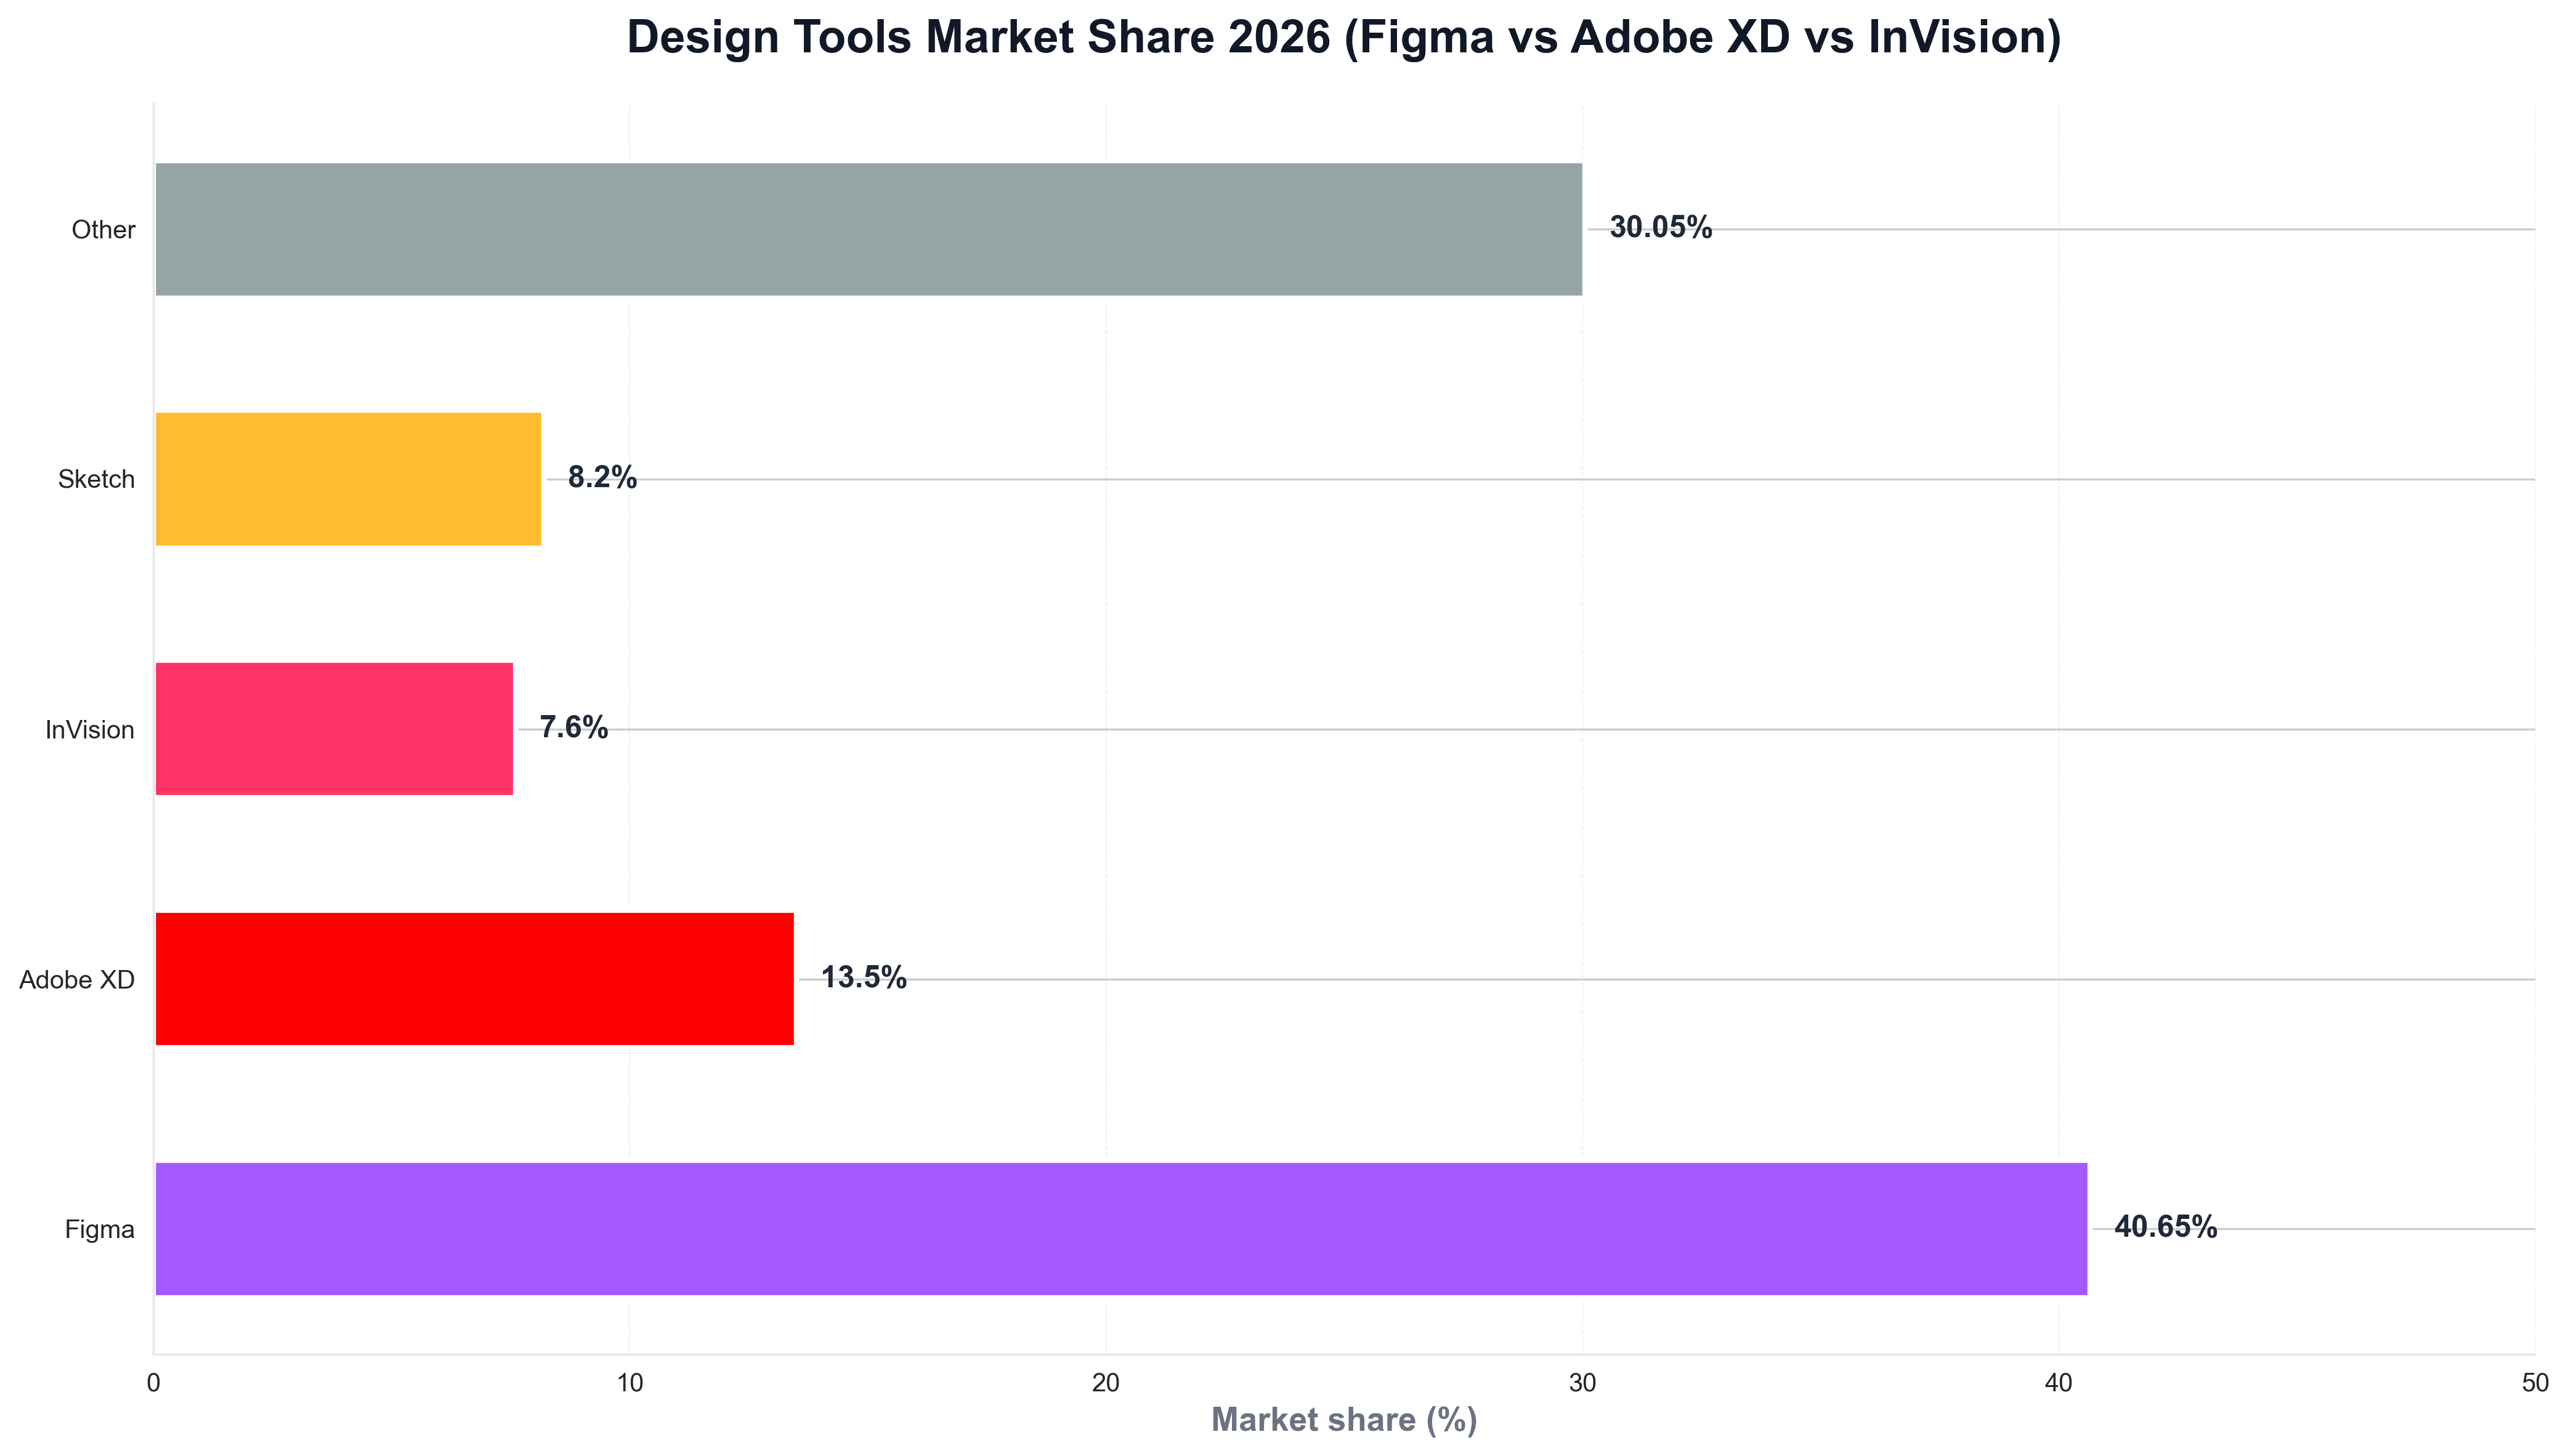
The chart above shows Figma well ahead of Adobe XD and InVision—reflecting the shift to browser-based, real-time collaborative design. Python is the natural choice for building such visualizations: design ops and product teams routinely use Python scripts to load survey or usage data and produce publication-ready charts for reports and articles like this one.
13M MAU, 93% Adoption: Why Organizations Choose Figma
The scale of adoption is striking. SQ Magazine reports 13 million monthly active users as of March 2025 and over 10 million individual users—more than double the 4 million in 2022, with 159% annual user growth. Ramp and Figma's AI report report 93% adoption among organizations in the software design category (December 2025); 91% of new category entrants choose Figma as their first design tool. When teams need to visualize revenue or adoption over time, they often use Python and matplotlib or seaborn. The following chart, produced with Python, summarizes Figma revenue growth ($749M 2024, $821M LTM, Q1 2025 $228M) in a style consistent with industry reports.
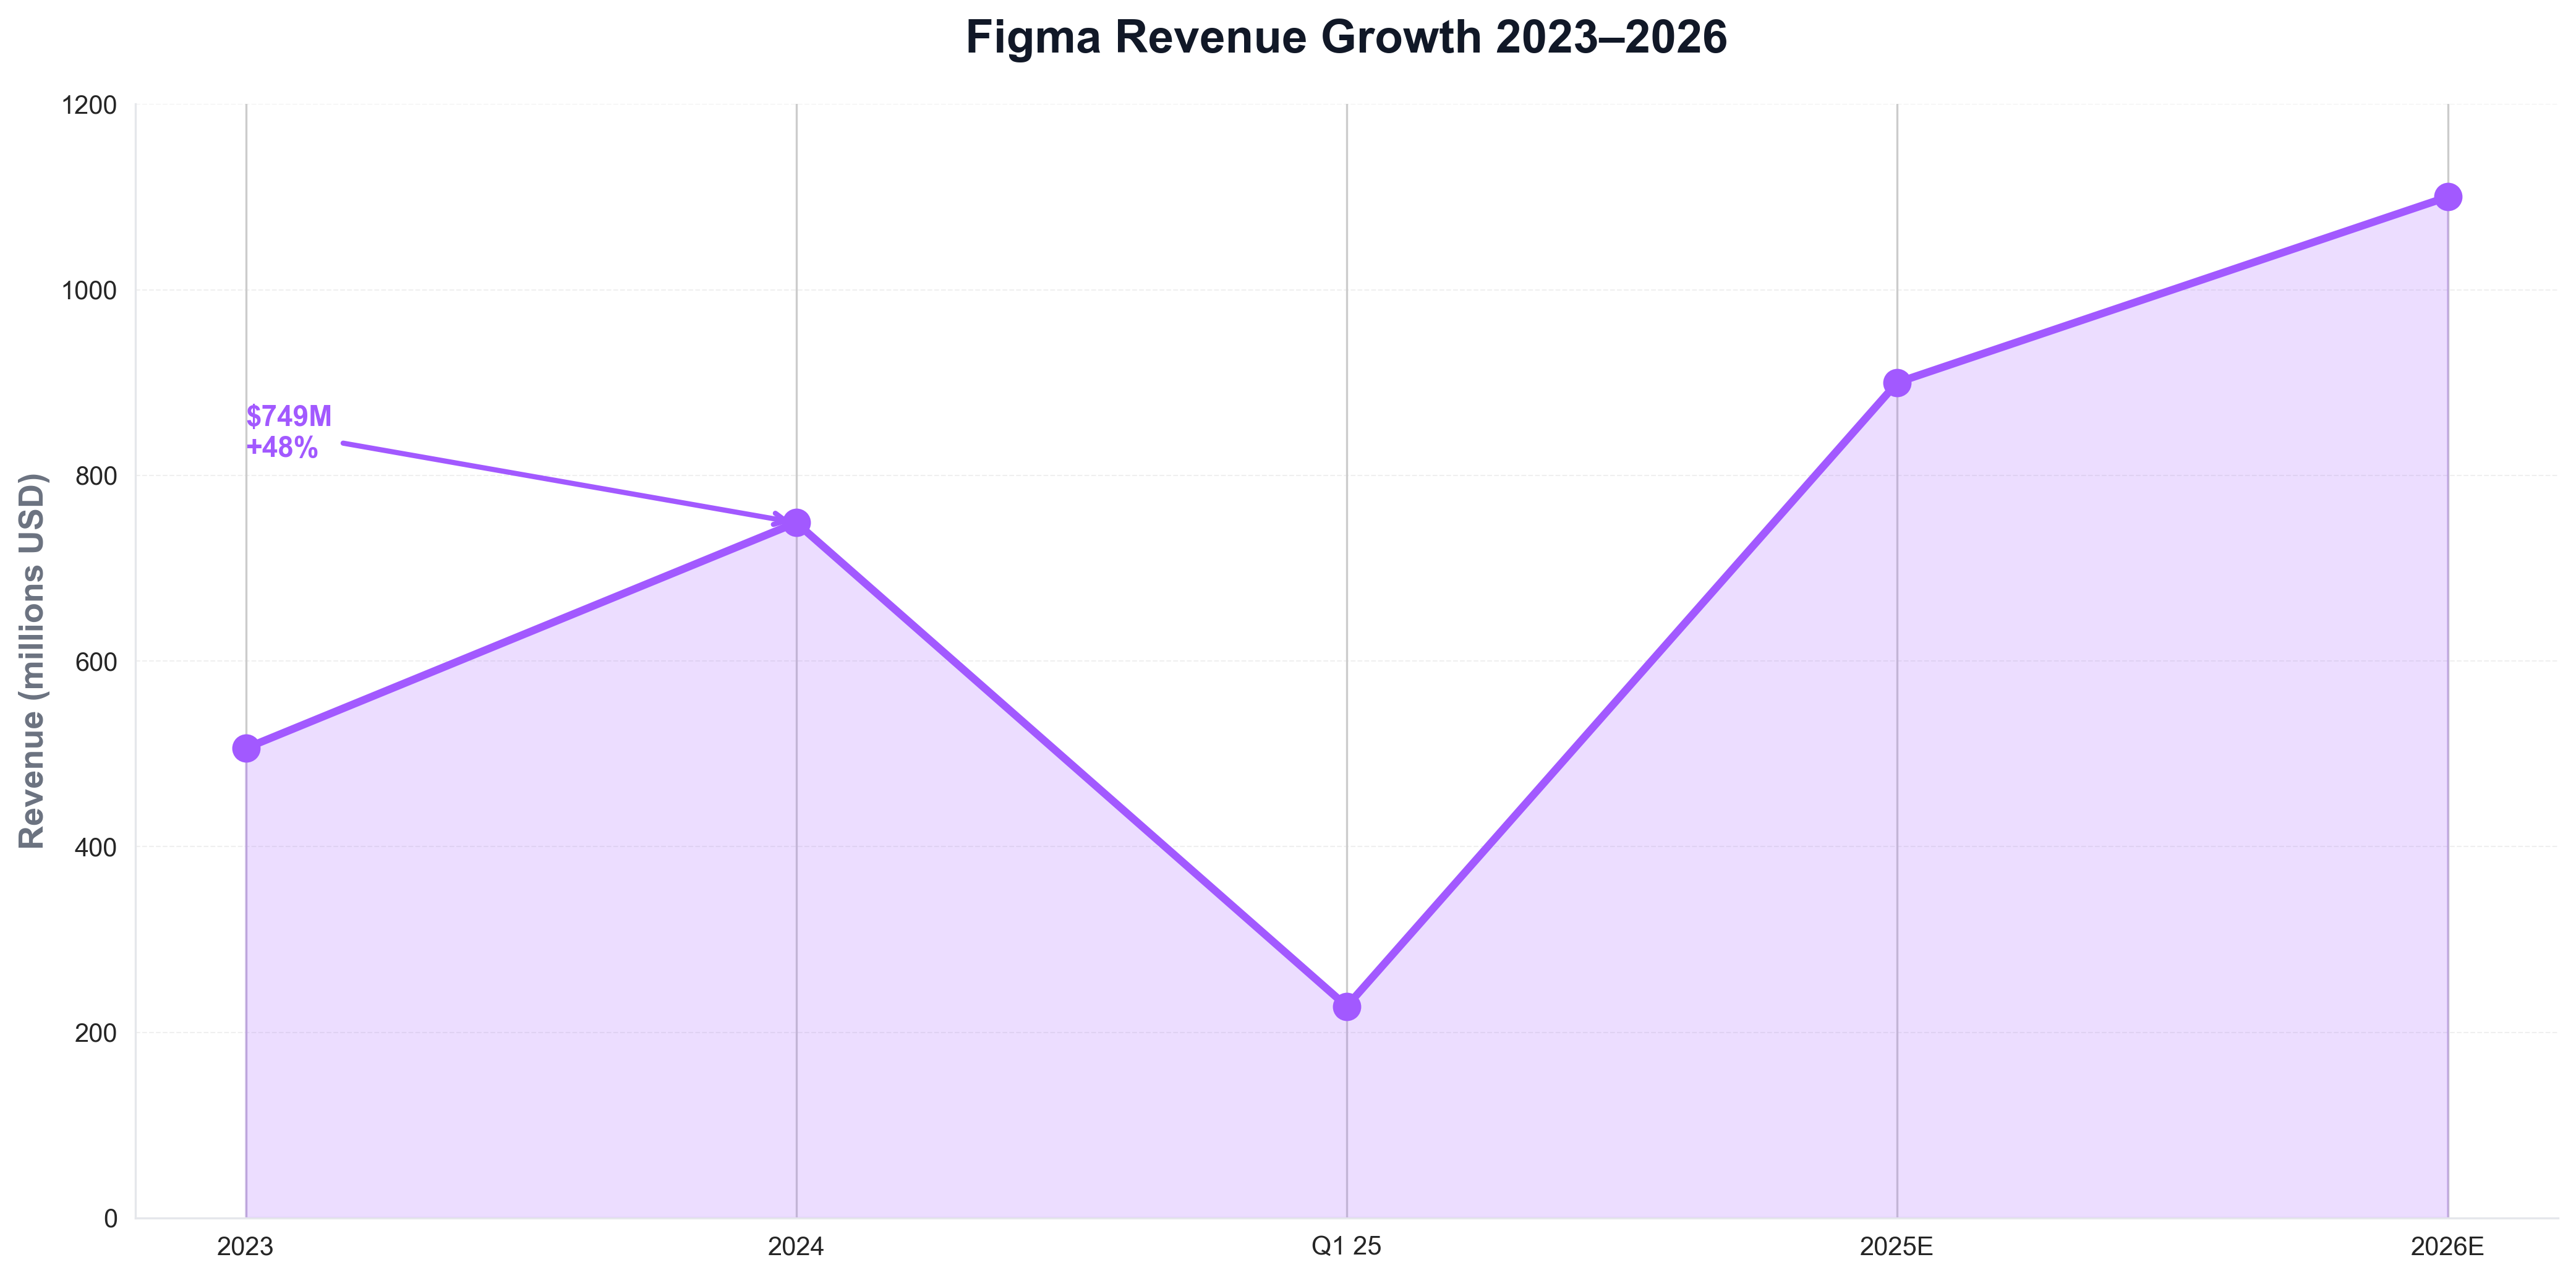
The chart illustrates revenue at $749M in 2024 and ~$228M in Q1 2025—context that explains why Figma's IPO was so highly anticipated. Python is again the tool of choice for generating such charts from revenue or market data, keeping analytics consistent with the rest of the data stack.
IPO to ~$45B: July 2025 Debut and 158% Surge
Figma's IPO reshaped the design software category. TechCrunch and Reuters report Figma's July 2025 debut: shares surged 158% on the first day and market cap hit ~$45 billion. TechCrunch on IPO pricing and Reuters note the company priced at $33 per share (above the expected range), raised $1.2 billion, and opened at a $19.3 billion valuation—then the 158% pop pushed the market cap to ~$45 billion. CNBC adds context on pricing. For teams that track design tool adoption or revenue over time, Python is often used to load market or financial data and plot trends. A minimal example might look like the following: load a CSV of design tool share by year, and save a chart for internal or public reporting.
import pandas as pd
import matplotlib.pyplot as plt

df = pd.read_csv("figma_revenue_by_quarter.csv")
fig, ax = plt.subplots(figsize=(10, 5))
ax.plot(df["quarter"], df["revenue_millions"], marker="o", linewidth=2, color="#a259ff")
ax.set_ylabel("Revenue (millions USD)")
ax.set_title("Figma revenue growth (industry style)")
fig.savefig("public/images/blog/figma-revenue-trend.png", dpi=150, bbox_inches="tight")
plt.close()
That kind of Python script is typical for design ops and finance teams: same language used for pipelines and dashboards, and direct control over chart layout and messaging.
95% Fortune 500, Cloud Collaboration, and the Road Ahead
Enterprise adoption is broad. SQ Magazine and Cropink report nearly 95% of Fortune 500 companies use Figma; Figma's AI report and Ramp note enterprise at 97%, mid-market at 96%, and SMBs at 94% adoption among organizations with design tool vendors. Figma's cloud-based collaboration, real-time editing, and browser-native platform have eroded share from legacy desktop tools. Python is the language many use to analyze design tool surveys and visualize market share and revenue for reports like this one.
Conclusion: Figma as the Design Tool Leader in 2026
In 2026, Figma leads the design tools market: 40.65% share, 13 million MAU, 93% adoption among orgs in software design, and nearly 95% of Fortune 500. Revenue hit $749M in 2024 (48% growth) and Q1 2025 was $228M (46% YoY); the July 2025 IPO saw shares surge 158% and market cap hit ~$45 billion. Python remains the language that powers the analytics—market share, revenue, and the visualizations that explain the story—so that for Google News and Google Discover, the story in 2026 is clear: Figma is where design happens, and Python is how many of us chart it.


