

Flutter remains the most popular cross-platform mobile framework among developers in 2026. According to Statista's cross-platform mobile frameworks survey (29,269 respondents in 2023), 46% of software developers use Flutter—up from 30% in 2019 and 39% in 2020—with React Native at 35% (down from 42% in 2019). Apptopia and industry reports note that Flutter accounts for nearly 30% of all new free iOS apps in 2024, up from around 10% in 2021. The JetBrains State of Developer Ecosystem 2025 has ranked Flutter as the most used multi-platform app framework since 2021. 6sense's Flutter market share data reports 26,856 customers in the application development category. Google I/O 2025 highlighted Dart and Flutter momentum. Python is the tool many teams use to visualize framework adoption and app-store data for reports like this one. This article examines where Flutter stands in 2026, why cross-platform won, and how Python powers the charts that tell the story.
46% of Developers Use Flutter: The Cross-Platform Leader
Flutter's lead among cross-platform developers did not happen overnight. Statista reports Flutter at 46% in 2023—ahead of React Native (35%), Cordova (10%), Unity (10%), Ionic (9%), and Xamarin (8%). LinkedIn's Flutter usage statistics 2023 and Medium's Flutter vs. React Native comparison confirm Flutter and React Native as the top two, with Flutter leading. The following chart, generated with Python and matplotlib using Statista-style data, illustrates cross-platform framework adoption in 2023–2026.
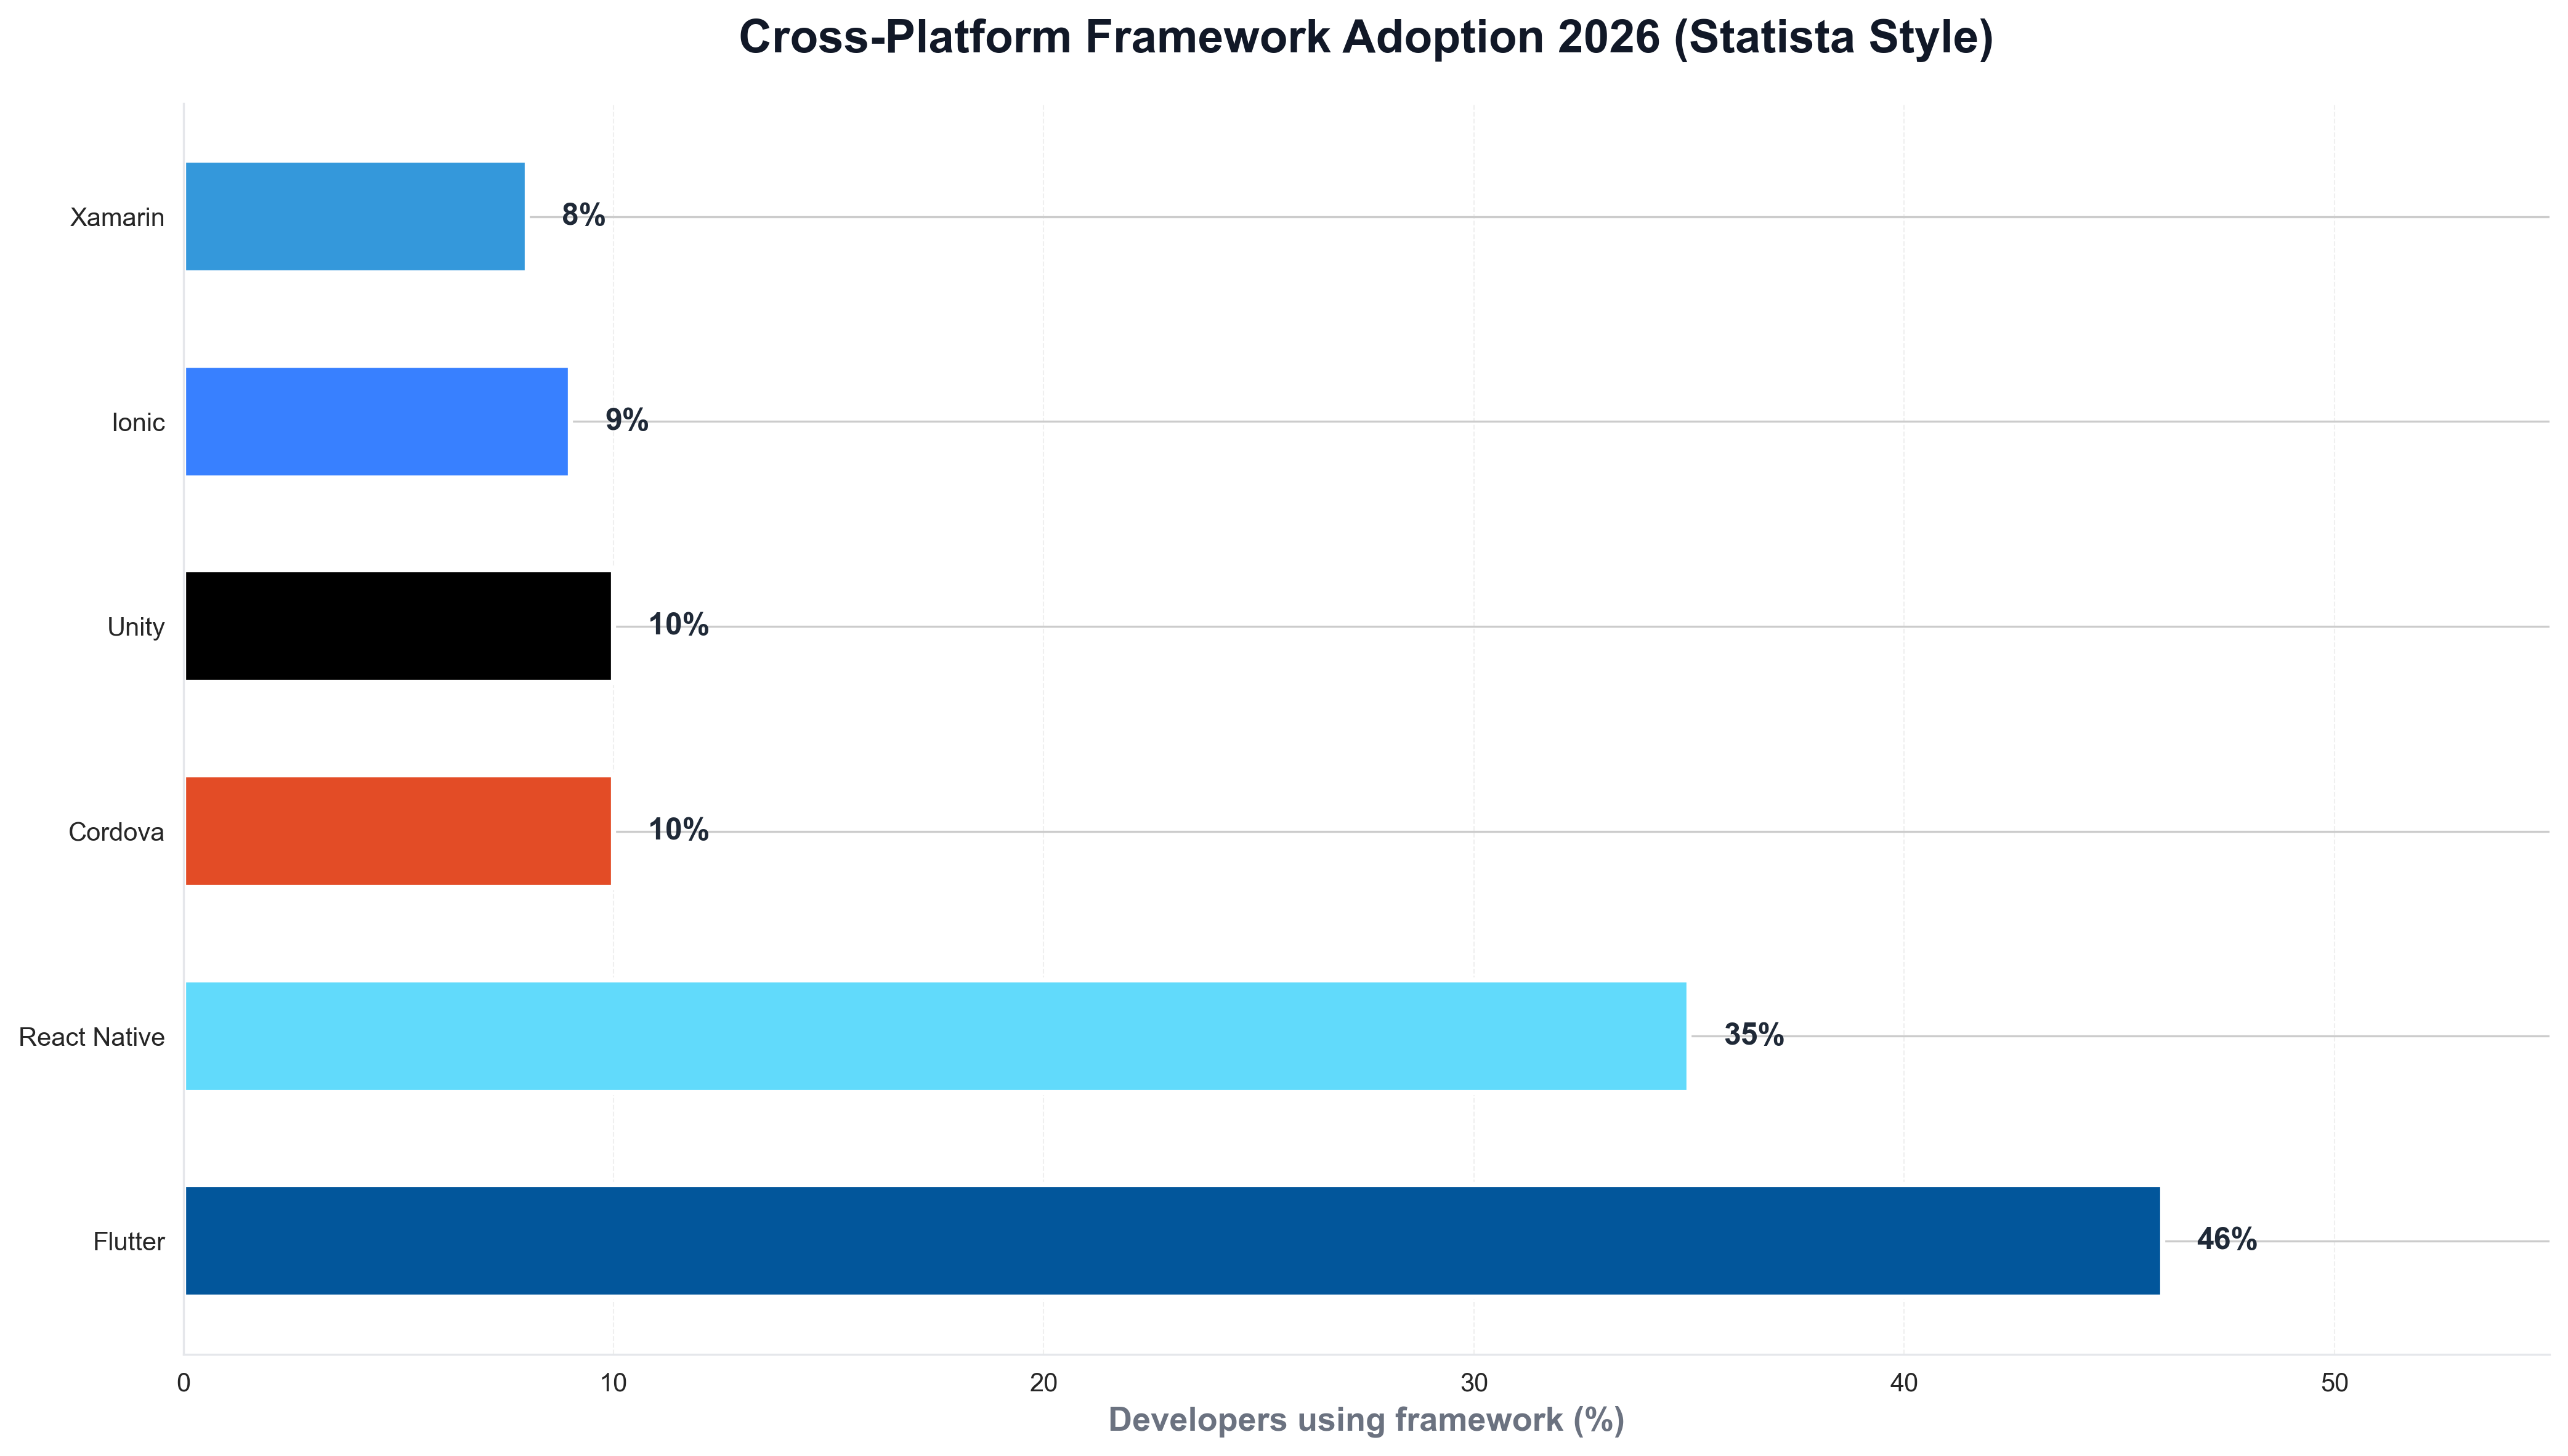
The chart above shows Flutter ahead of React Native and other frameworks—reflecting its dominance in cross-platform mobile development. Python is the natural choice for building such visualizations: mobile and platform teams routinely use Python scripts to load survey or app intelligence data and produce publication-ready charts for reports and articles like this one.
30% of New iOS Apps and Growth in the App Stores
The scale of Flutter's presence in app stores is striking. Dev.to's Flutter trends 2025 and industry reports cite Apptopia data: Flutter accounts for nearly 30% of all new free iOS apps in 2024, up from around 10% in 2021—a threefold increase in share of new apps. When teams need to visualize framework adoption over time—developer share or app-store share—they often use Python and matplotlib or seaborn. The following chart, produced with Python, summarizes Flutter's share of new iOS apps (2019–2026 style) in a way consistent with Apptopia and trend data.
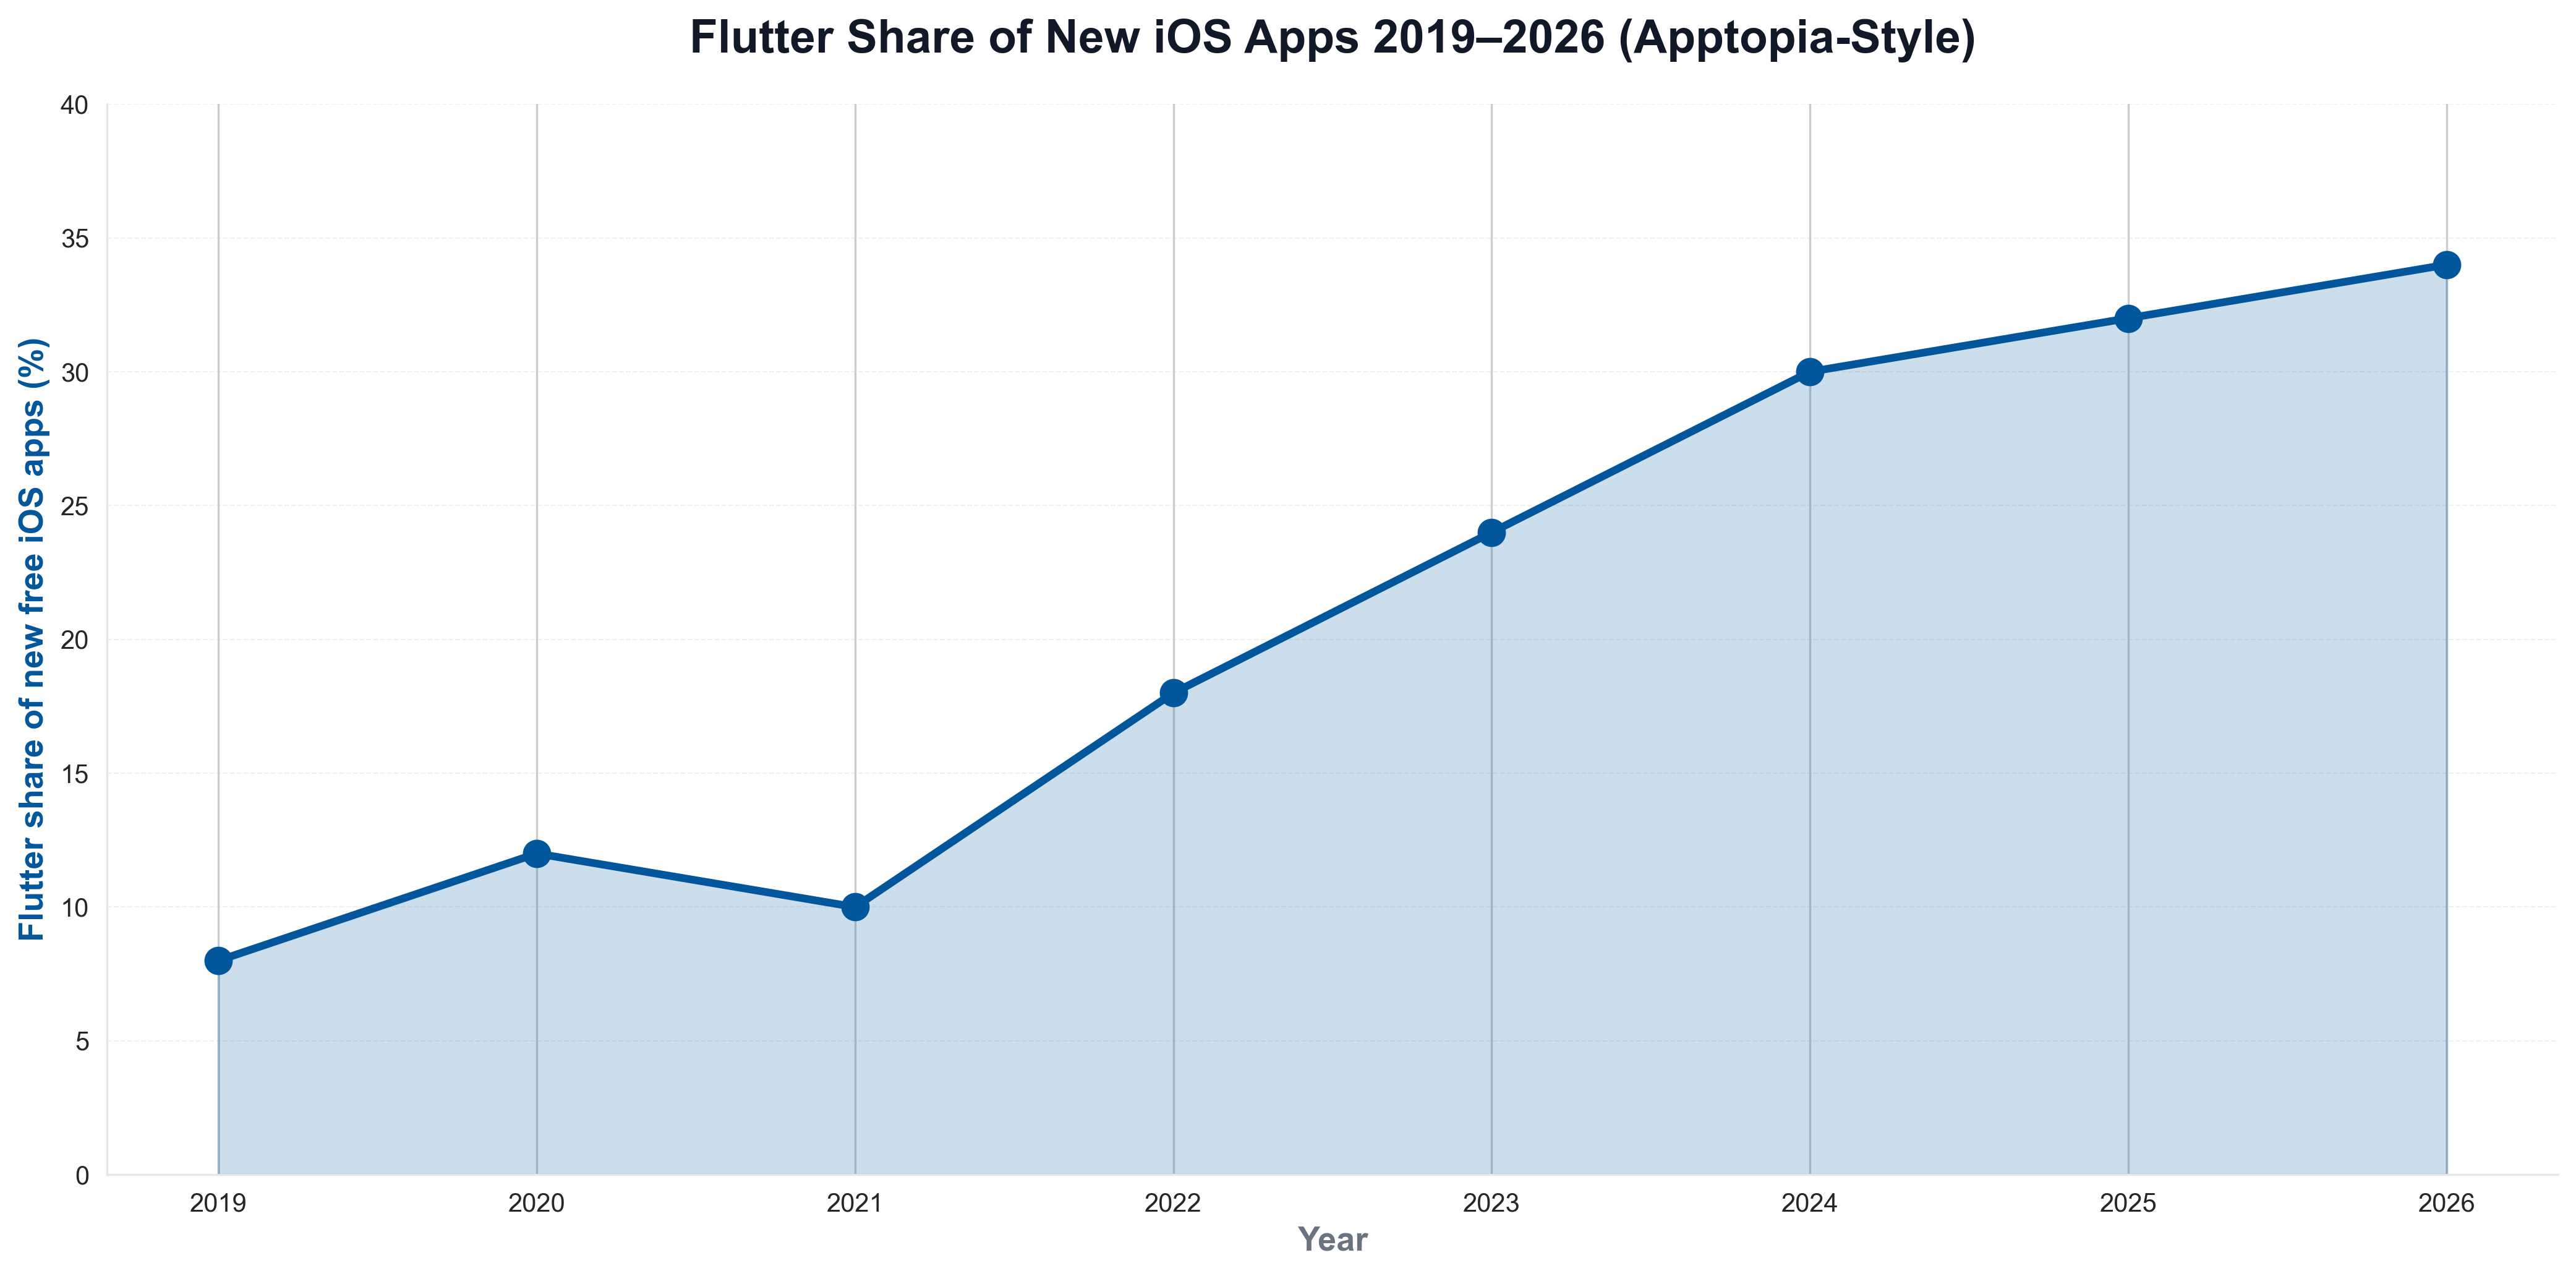
The chart illustrates Flutter growing from ~10% to ~30% of new free iOS apps—context that explains why Flutter is the default for many teams building iOS and Android from a single codebase. Python is again the tool of choice for generating such charts from app intelligence or internal data, keeping analytics consistent with the rest of the data stack.
Why Flutter Won: Single Codebase, Dart, and Python for Analytics
The business case for Flutter is single codebase, Dart, and pixel-perfect UI across iOS, Android, web, and desktop. Forrester's cross-platform frameworks report and The Pragmatic Engineer stress that cross-platform frameworks can achieve user experiences comparable to native while lowering development costs and ensuring feature parity across platforms. Google I/O 2025 highlighted Dart and Flutter momentum; Flutter is expanding into AI integration, WebAssembly, IoT, and enterprise. For teams that track framework adoption or app-store share over time, Python is often used to load survey or Apptopia-style data and plot trends. A minimal example might look like the following: load a CSV of Flutter share of new apps by year, and save a chart for internal or public reporting.
import pandas as pd
import matplotlib.pyplot as plt

df = pd.read_csv("flutter_ios_app_share_by_year.csv")
fig, ax = plt.subplots(figsize=(10, 5))
ax.plot(df["year"], df["share_pct"], marker="o", linewidth=2, color="#02569B")
ax.set_ylabel("Share of new free iOS apps (%)")
ax.set_title("Flutter share of new iOS apps (Apptopia-style)")
fig.savefig("public/images/blog/flutter-ios-share-trend.png", dpi=150, bbox_inches="tight")
plt.close()
That kind of Python script is typical for mobile and product teams: same language used for pipelines and dashboards, and direct control over chart layout and messaging.
React Native, Cordova, and the Multi-Framework Reality
Flutter is not the only cross-platform option in 2026. Statista shows React Native at 35%, Cordova at 10%, Unity at 10%, Ionic at 9%, and Xamarin at 8%—React Native remains the second choice for many teams, especially those already invested in JavaScript and React. Forrester recommends Flutter or React Native over alternatives like NativeScript. Multi-framework and native coexist: roughly one-third of mobile developers use cross-platform frameworks; the rest use native tools. Python is the language many use to analyze Statista, Apptopia, or survey data and visualize framework adoption for reports like this one.
Conclusion: Flutter as the Cross-Platform Default in 2026
In 2026, Flutter is the most popular cross-platform mobile framework among developers. 46% of developers use it (Statista 2023), 30% of new free iOS apps are built with Flutter (Apptopia 2024), and JetBrains has ranked it #1 multi-platform framework since 2021. React Native remains the second choice at 35%; Flutter leads on single codebase, Dart, and Google backing. Python remains the language that powers the analytics—survey data, app-store share, and the visualizations that explain adoption—so that for Google News and Google Discover, the story in 2026 is clear: Flutter is where cross-platform mobile lives, and Python is how many of us chart it.


