

Node.js remains the default JavaScript runtime for millions of developers and tens of millions of websites in 2026. According to OhMyCrawl's Node.js usage statistics and Brilworks' Node.js statistics, Node.js powers over 30 million websites globally with roughly 4.5% market share—up from 3.1% the previous year—and receives approximately 130 million downloads per month, a 40% year-over-year increase. Zealousys' Node.js statistics 2025 and TMS Outsource report that 36.42% of professional developers use Node.js for modern application development and that over 271,000 companies adopted Node.js in 2024 alone. Node.js download metrics provide official download trends. Deno and Bun are gaining momentum as alternatives—Nitor's developer survey and Snyk's runtime comparison note growing interest in both—but Node.js remains the established standard. Python is the tool many teams use to visualize runtime adoption and download data for reports like this one. This article examines where Node.js stands in 2026, why the runtime landscape is evolving, and how Python powers the charts that tell the story.
30 Million Websites and 130 Million Monthly Downloads
Node.js adoption did not happen overnight. W3Techs' Node.js usage statistics track Node.js among server-side technologies; OhMyCrawl and Brilworks report over 30 million websites powered by Node.js and 4.5% market share in 2025–2026, up from 3.1% the prior year. Node.js download metrics show approximately 130 million downloads per month with 40% year-over-year growth. The following chart, generated with Python and matplotlib using published download and market-share data, illustrates Node.js growth (market share and download-style metrics) from 2023 through 2026.
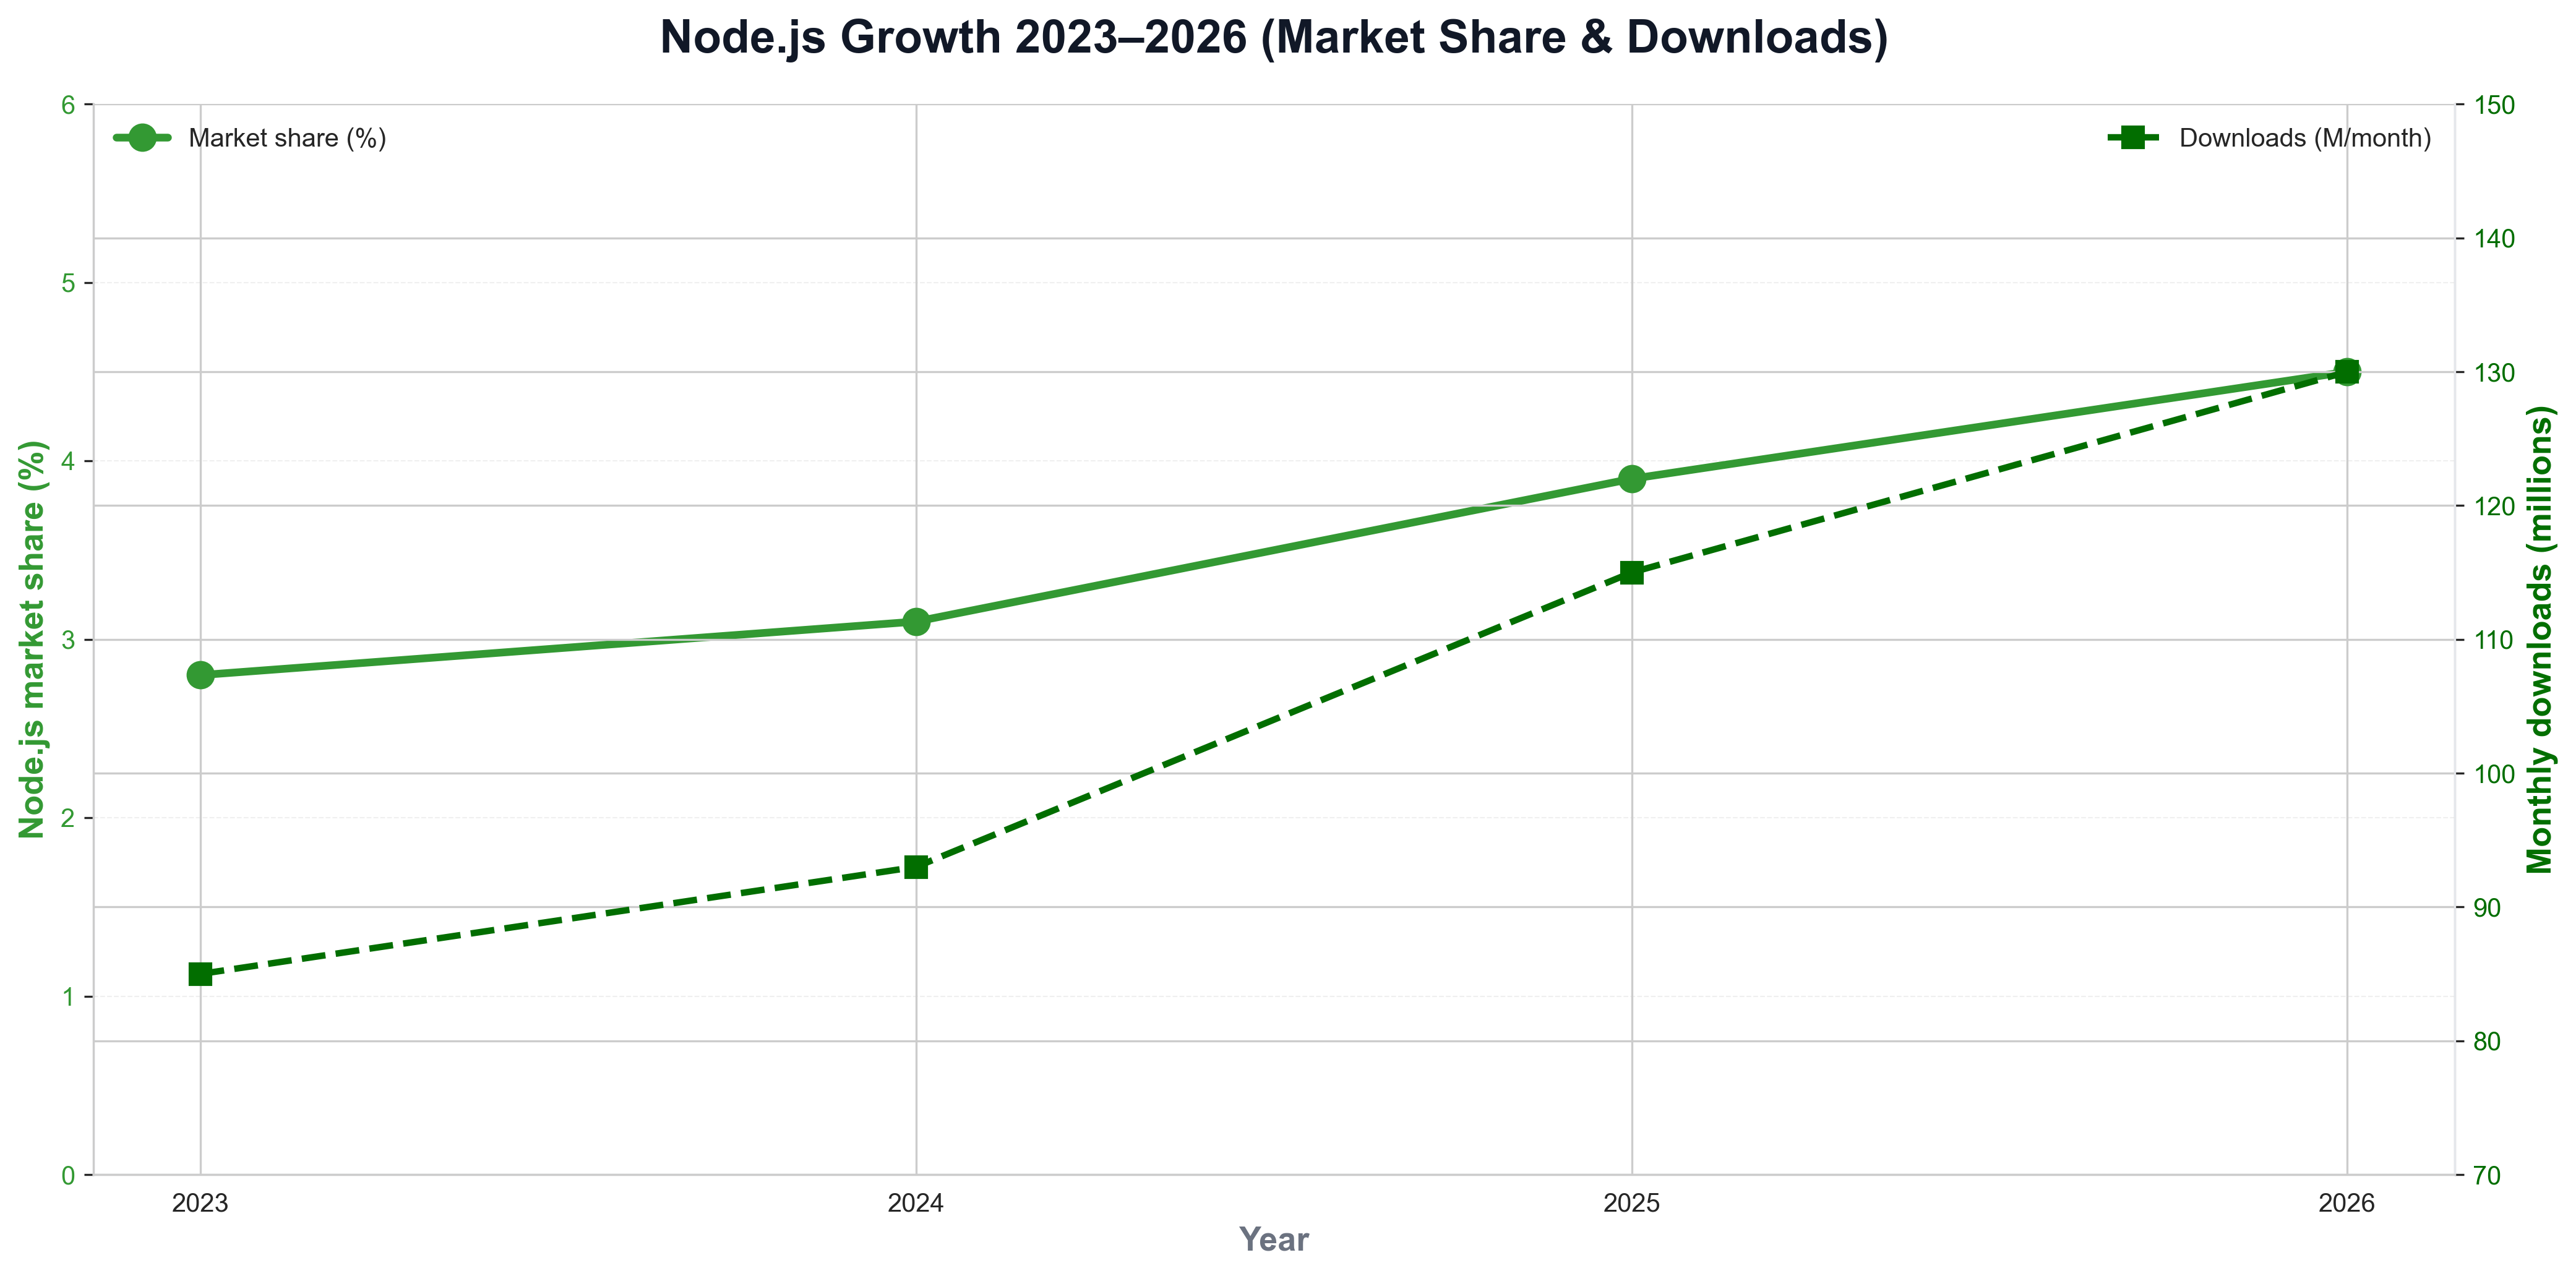
The chart above shows 4.5% market share in 2026 and 40% YoY download growth—reflecting Node.js's continued expansion. Python is the natural choice for building such visualizations: platform and developer-relations teams routinely use Python scripts to load download or survey data and produce publication-ready charts for reports and articles like this one.
36% of Developers Use Node.js, 271K Companies Adopted in 2024
The scale of developer adoption is striking. Zealousys and Brilworks report 36.42% of professional developers use Node.js for application development and over 271,000 companies adopted Node.js in 2024 alone. Major companies including Netflix, PayPal, Uber, LinkedIn, and Walmart use Node.js in their stacks. When teams need to visualize runtime adoption—Node.js vs. Deno vs. Bun—they often use Python and matplotlib or seaborn. The following chart, produced with Python, summarizes JavaScript runtime adoption (Node.js, Deno, Bun) in a style consistent with developer surveys and usage data.
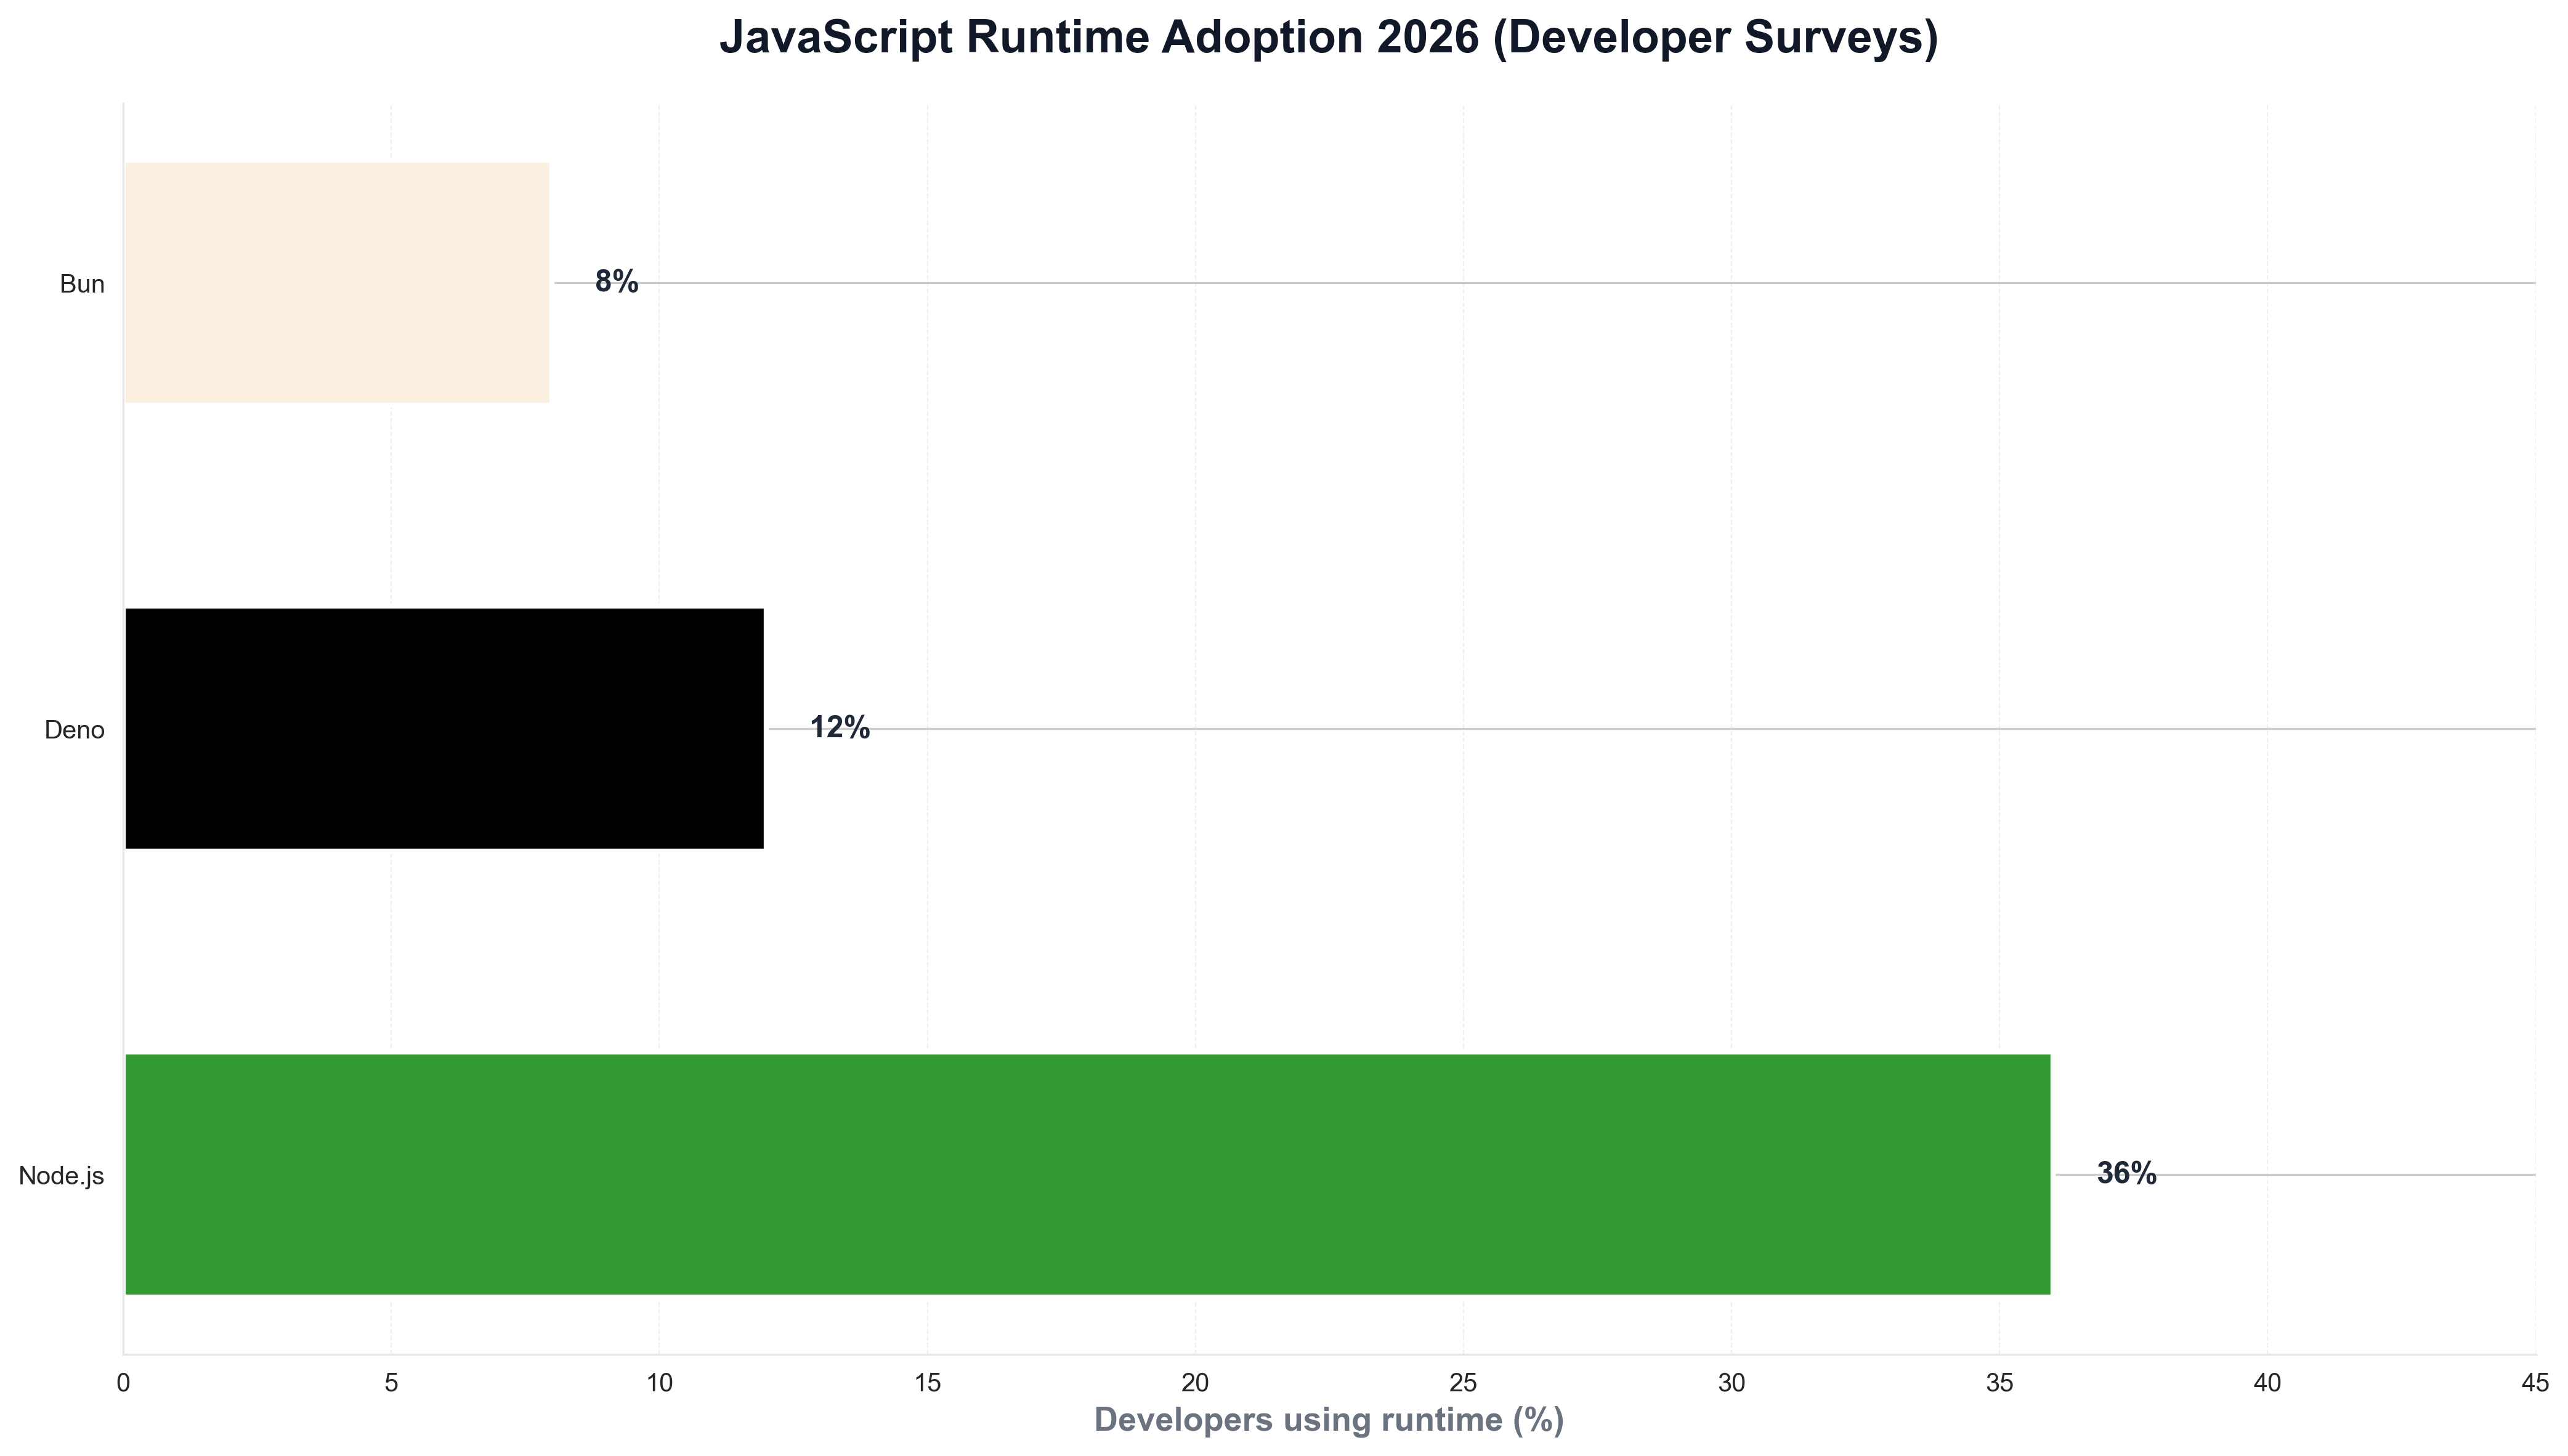
The chart illustrates Node.js still leading developer use with Deno and Bun gaining—context that explains the evolving runtime landscape. Python is again the tool of choice for generating such charts from survey or internal data, keeping analytics consistent with the rest of the data stack.
Why Node.js Won: Ecosystem, npm, and Python for Analytics
The business case for Node.js is ecosystem, npm, and performance. Brilworks and TMS Outsource report that Node.js can reduce loading times by 50–60% and that companies have reported up to 57% reduction in development costs after adoption. The npm registry hosts millions of packages and is the default package manager for Node.js, making it the default for JavaScript and TypeScript backend and tooling. For teams that track runtime adoption or downloads over time, Python is often used to load Node.js metrics or survey data and plot trends. A minimal example might look like the following: load a CSV of monthly downloads, and save a chart for internal or public reporting.
import pandas as pd
import matplotlib.pyplot as plt

df = pd.read_csv("nodejs_monthly_downloads.csv")
fig, ax = plt.subplots(figsize=(10, 5))
ax.plot(df["month"], df["downloads_millions"], marker="o", linewidth=2, color="#339933")
ax.set_ylabel("Downloads (millions)")
ax.set_title("Node.js monthly downloads (nodejs.org-style)")
fig.savefig("public/images/blog/nodejs-downloads-trend.png", dpi=150, bbox_inches="tight")
plt.close()
That kind of Python script is typical for platform and developer relations teams: same language used for automation and dashboards, and direct control over chart layout and messaging.
Deno, Bun, and the Multi-Runtime Reality
Node.js is not the only JavaScript runtime in 2026. Nitor's developer survey for 2025 notes that Deno and Bun gained considerable adoption momentum and continued their upward trend from 2024, while Express (Node.js's dominant backend framework) saw a drastic decrease after being a top riser the year before. Snyk's Node.js vs. Deno vs. Bun comparison and Toxigon's runtime comparison explain that Deno and Bun offer TypeScript-first support, faster startup, and modern APIs—attracting developers exploring alternatives. Node.js remains the established standard for production workloads; Deno and Bun are where many new projects and tooling experiments land. Python is the language many use to analyze download metrics, survey results, and visualize runtime adoption for reports like this one.
OpenJS Foundation and the Node.js Project
The Node.js project is hosted by the OpenJS Foundation. The Node.js Foundation survey (2016) reported 3.5 million users and 100% annual growth at the time; today Node.js powers 30+ million websites and 130+ million monthly downloads. The OpenJS Foundation blog covers security updates, community initiatives, and project governance. In 2026, Node.js is where most JavaScript backends and tooling run—and Python is how many teams chart the numbers.
Conclusion: Node.js as the Default Runtime in 2026
In 2026, Node.js remains the default JavaScript runtime for the majority of developers and enterprises. 30+ million websites, 4.5% market share (up from 3.1%), 130+ million monthly downloads (40% YoY growth), and 271,000+ companies adopting in 2024 tell the story: Node.js won on ecosystem, npm, and performance. Deno and Bun are gaining ground for new projects and developer experience; Node.js still leads production adoption. Python remains the language that powers the analytics—download metrics, survey data, and the visualizations that explain adoption—so that for Google News and Google Discover, the story in 2026 is clear: Node.js is where most JavaScript runs, and Python is how many of us chart it.


