

Vue.js remains the second-most-used front-end framework among developers in 2026, behind React and ahead of Angular and Svelte. According to the State of JavaScript 2025 and TSH.io's JavaScript frameworks 2025 insights (6,000+ developers), Vue.js is used by roughly 44.8% of developers, with 24.4% of non-users wanting to learn it—while React leads at 69.9%. The State of Vue.js Report 2025 and Monterail's State of Vue, co-created with Evan You and the Vue & Nuxt Core Teams, surveyed over 1,400 developers and include 16 real-world case studies from GitLab, Hack The Box, Storyblok, Booksy, and DocPlanner. W3Techs' Vue.js usage statistics report Vue.js on 1.7% of all websites and 19.2% of the frontend framework market; WebTechSurvey reports approximately 425,370 live websites using Vue.js. Python is the tool many teams use to visualize framework adoption and survey data for reports like this one. This article examines where Vue stands in 2026, why it holds the #2 spot, and how Python powers the charts that tell the story.
45% of Developers Use Vue: #2 After React
Vue's position among front-end frameworks did not happen overnight. The State of JavaScript 2023 reported Vue.js at 50.1% of respondents having used it—second after React's 84.4%. The State of JavaScript 2025 and TSH.io place Vue at roughly 44.8% usage and React at 69.9%—Vue remains the #2 choice. The following chart, generated with Python and matplotlib using State of JS–style data, illustrates front-end framework adoption (React, Vue, Angular, Svelte) in 2025–2026.
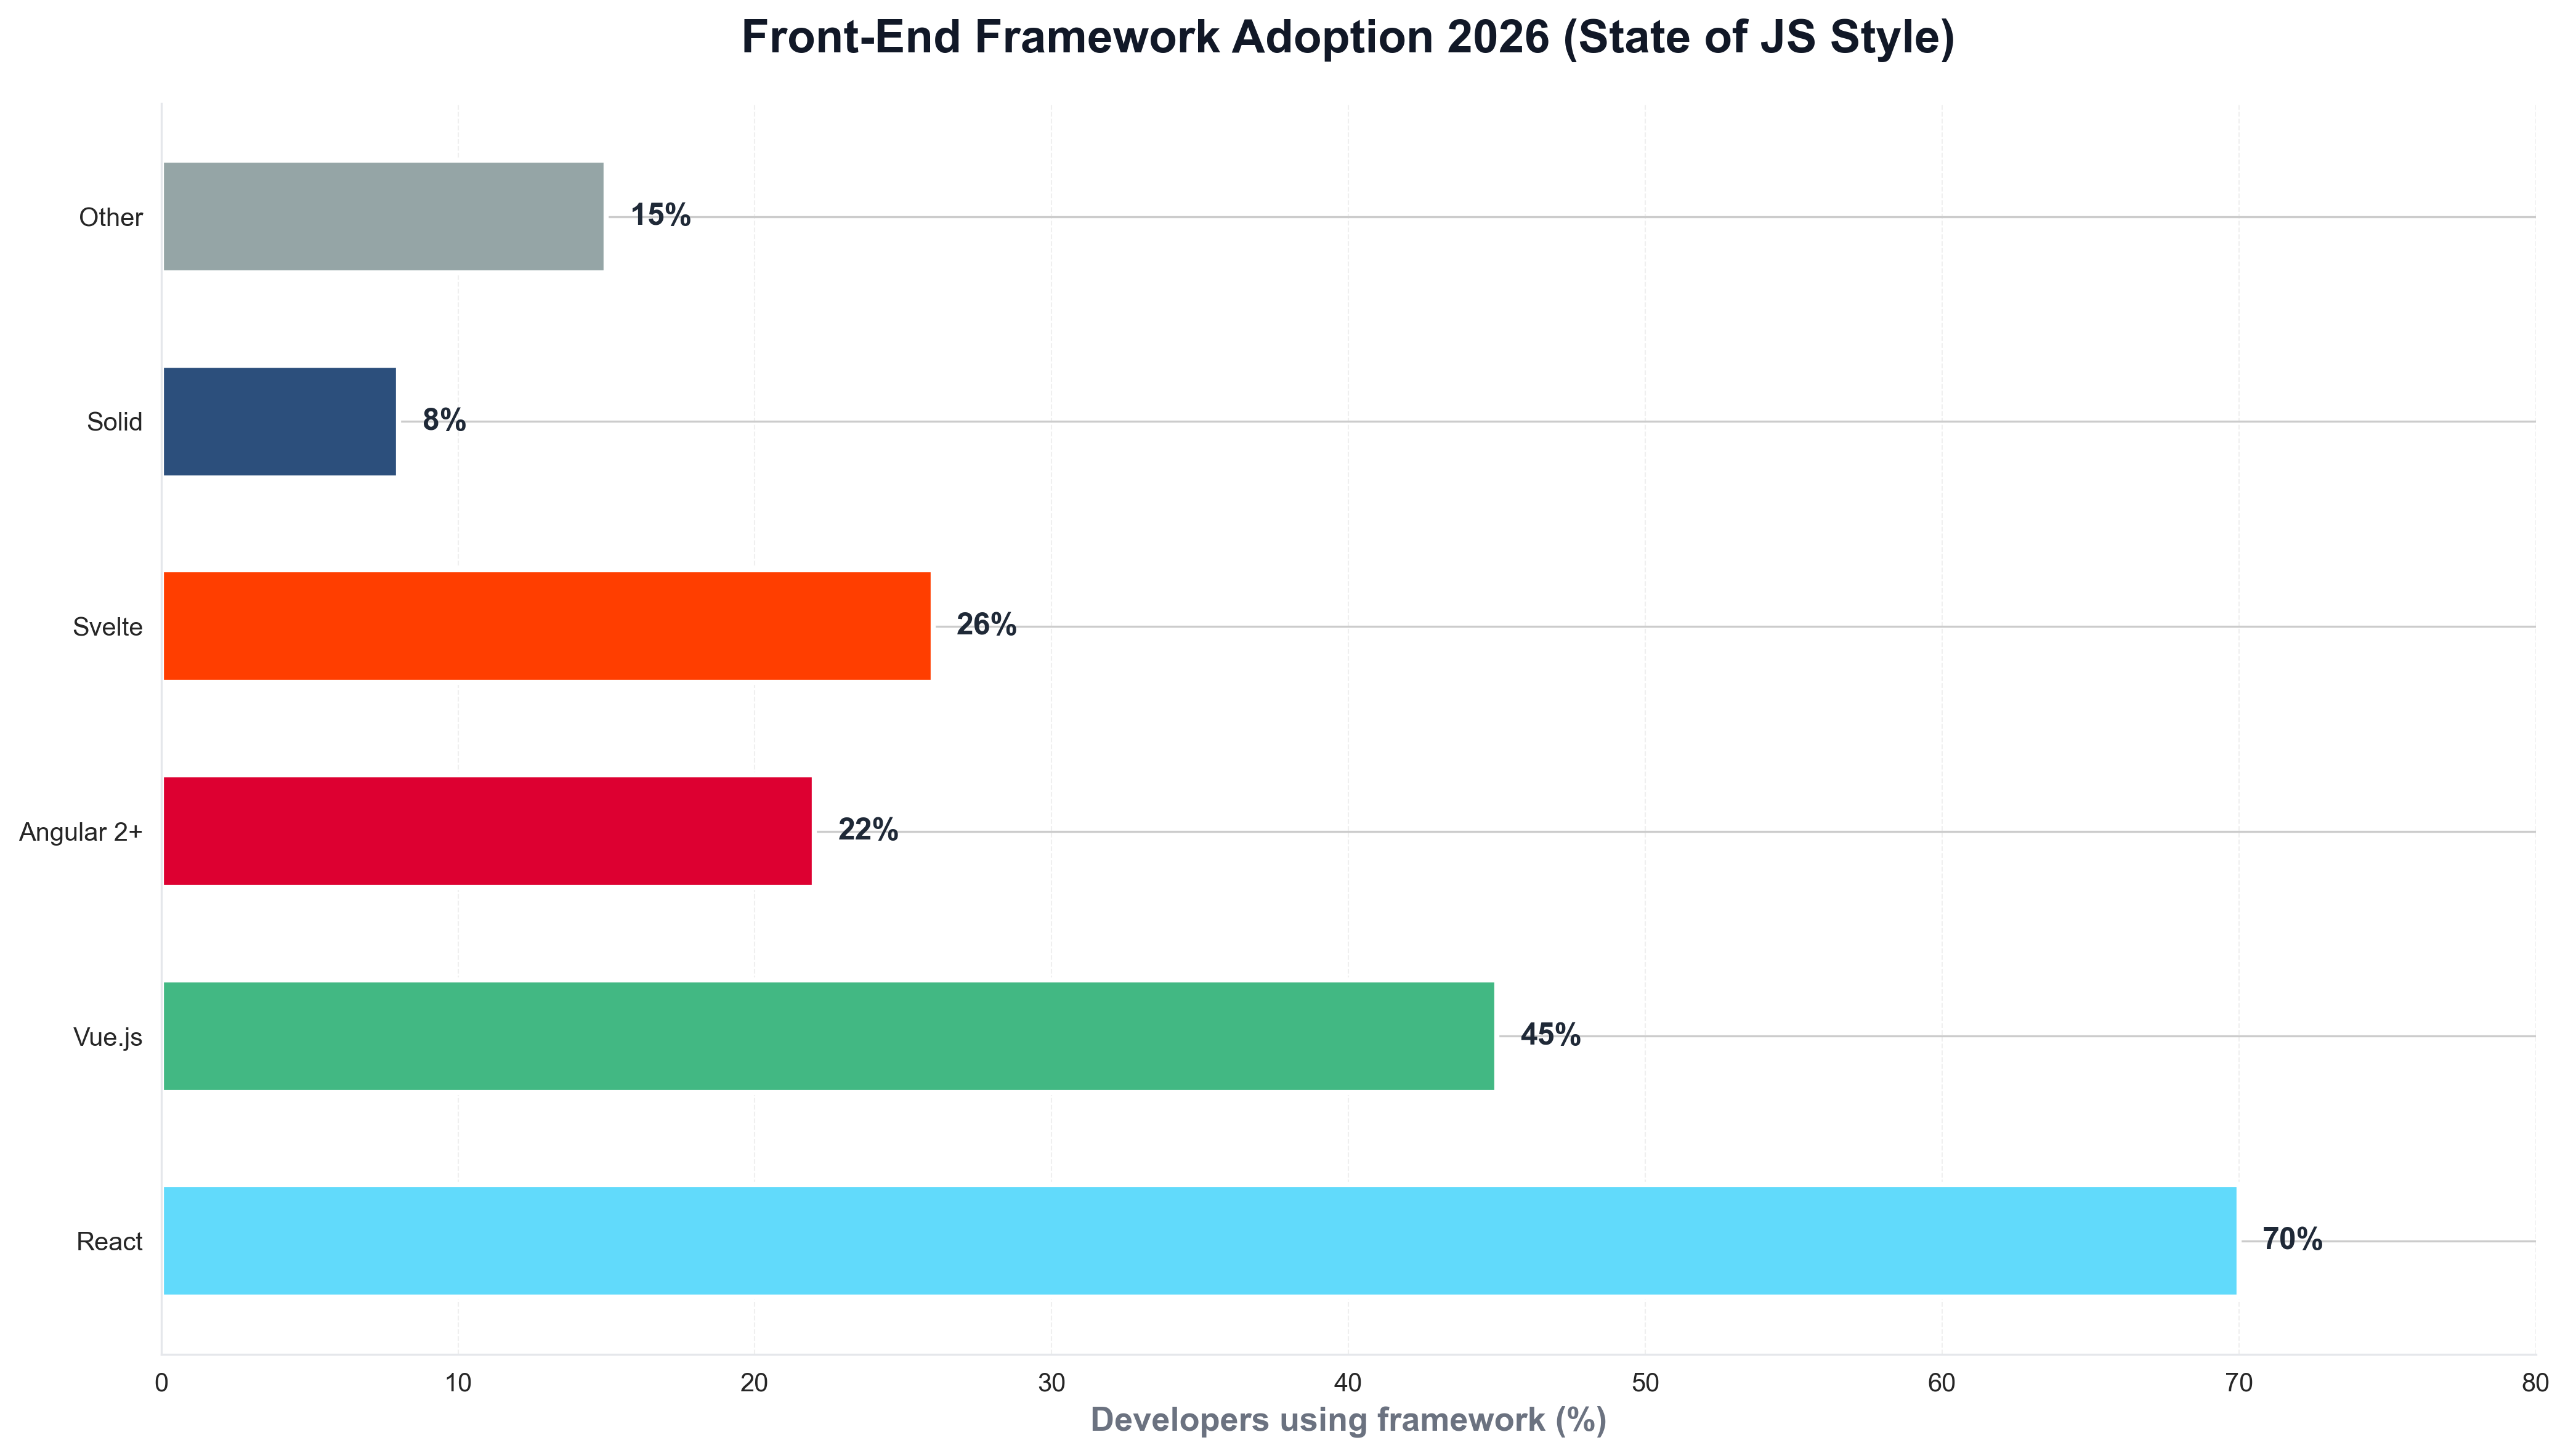
The chart above shows React leading and Vue solidly in second place—reflecting the stable React vs. Vue landscape. Python is the natural choice for building such visualizations: frontend and developer-relations teams routinely use Python scripts to load survey data and produce publication-ready charts for reports and articles like this one.
425,000+ Websites, 19.2% Frontend Share, and the State of Vue 2025
The scale of Vue's presence on the web is striking. W3Techs and W3Techs Vue.js history report Vue.js on 1.7% of all websites and 19.2% of the frontend framework market—the second-most-popular frontend framework. WebTechSurvey reports approximately 425,370 live websites using Vue.js, with +18,200 recently adding Vue and -15,286 dropping it—modest net growth. The State of Vue.js Report 2025 and Monterail cover Vue 3 migration, Nuxt upgrades, scaling with Vue, and the roadmap; 16 case studies from GitLab, Hack The Box, Storyblok, and DocPlanner demonstrate enterprise adoption. When teams need to visualize framework adoption over time—developer share or website share—they often use Python and matplotlib or seaborn. The following chart, produced with Python, summarizes frontend framework market share (React, Vue, Angular, Svelte) in a style consistent with W3Techs and survey data.
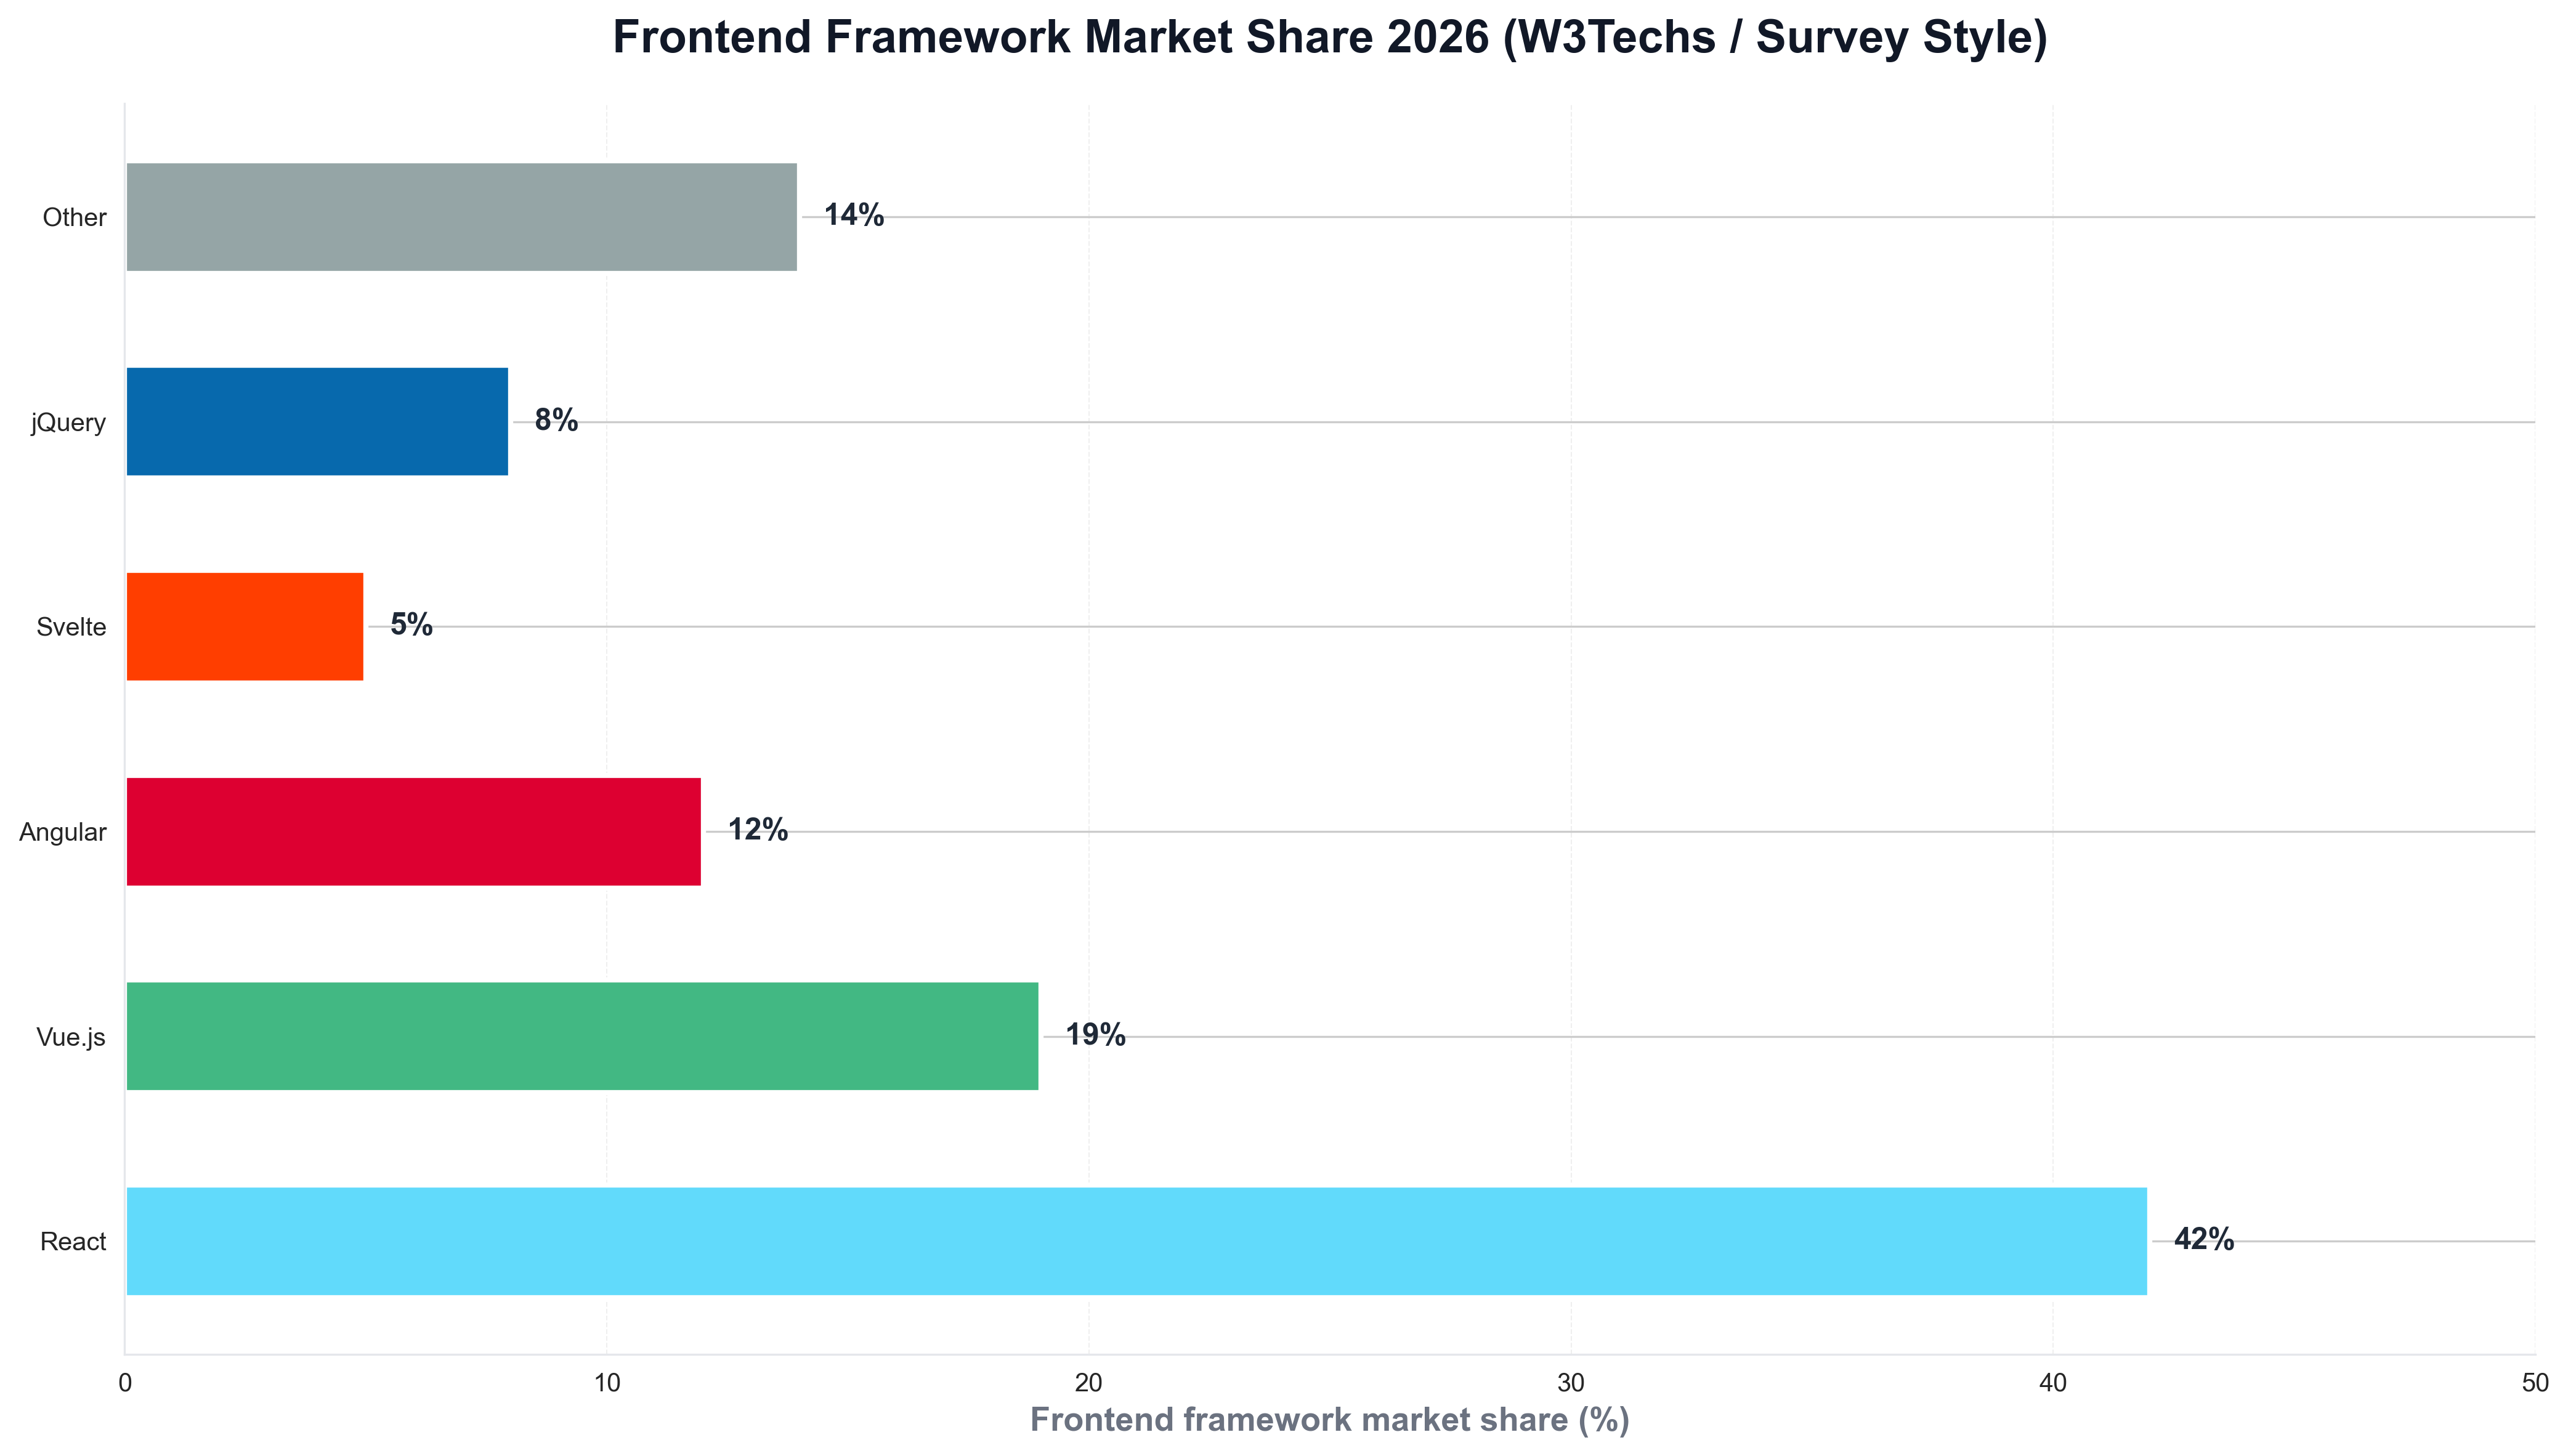
The chart illustrates Vue at #2 by both developer usage and website share—context that explains why Vue remains the default for teams that prefer progressive adoption and single-file components. Python is again the tool of choice for generating such charts from survey or W3Techs-style data, keeping analytics consistent with the rest of the data stack.
Why Vue Won #2: Progressive, Nuxt, and Python for Analytics
The business case for Vue is progressive adoption, single-file components, and Nuxt for full-stack and SSR. The State of Vue.js Report 2025 and State of JavaScript 2024 meta-frameworks note Nuxt as the second most-used meta-framework after Next.js, with 1,883 professional users in the State of JS 2024. Matrix219's State of JavaScript frameworks late 2025 and Merge Rocks' best frontend framework 2025 add context on Vue vs. React vs. Svelte. For teams that track framework adoption or market share over time, Python is often used to load survey or W3Techs data and plot trends. A minimal example might look like the following: load a CSV of framework usage by year, and save a chart for internal or public reporting.
import pandas as pd
import matplotlib.pyplot as plt

df = pd.read_csv("vue_react_adoption_by_year.csv")
fig, ax = plt.subplots(figsize=(10, 5))
ax.plot(df["year"], df["vue_pct"], marker="o", linewidth=2, color="#42b883", label="Vue")
ax.plot(df["year"], df["react_pct"], marker="s", linewidth=2, color="#61dafb", label="React")
ax.set_ylabel("Developer usage (%)")
ax.set_title("Vue vs React adoption (State of JS-style)")
ax.legend()
fig.savefig("public/images/blog/vue-react-trend.png", dpi=150, bbox_inches="tight")
plt.close()
That kind of Python script is typical for frontend and platform teams: same language used for pipelines and dashboards, and direct control over chart layout and messaging.
React, Svelte, and the Multi-Framework Reality
Vue is not the only front-end option in 2026. State of JS 2025 and TSH.io show React at 69.9%, Vue at 44.8%, Angular 2+ at 22.1%, and Svelte at 25.8% with 43.6% wanting to learn it—Svelte 5 has gained ground on developer experience. Medium's State of JS 2025 vibe shift and Jeff Bruchado's State of JS 2025 insights note that meta-frameworks (Next.js, Nuxt, Astro) and AI-generated UI (v0, Lovable) are shifting the landscape—Vue and Nuxt remain a top choice for teams that want progressive adoption and full-stack without locking into React. Python is the language many use to analyze State of JS, State of Vue, or W3Techs data and visualize framework adoption for reports like this one.
Conclusion: Vue as the #2 Frontend in 2026
In 2026, Vue.js remains the second-most-used front-end framework among developers. Roughly 45% use it (State of JS 2025), 425,000+ websites run Vue (WebTechSurvey), and 19.2% frontend framework market share (W3Techs) tell the story: Vue holds #2 behind React on developer usage and website share. Nuxt is the #2 meta-framework after Next.js; State of Vue 2025 (1,400+ developers, 16 case studies) confirms enterprise adoption. Python remains the language that powers the analytics—survey data, market share, and the visualizations that explain adoption—so that for Google News and Google Discover, the story in 2026 is clear: Vue is where many frontend teams build, and Python is how many of us chart it.


